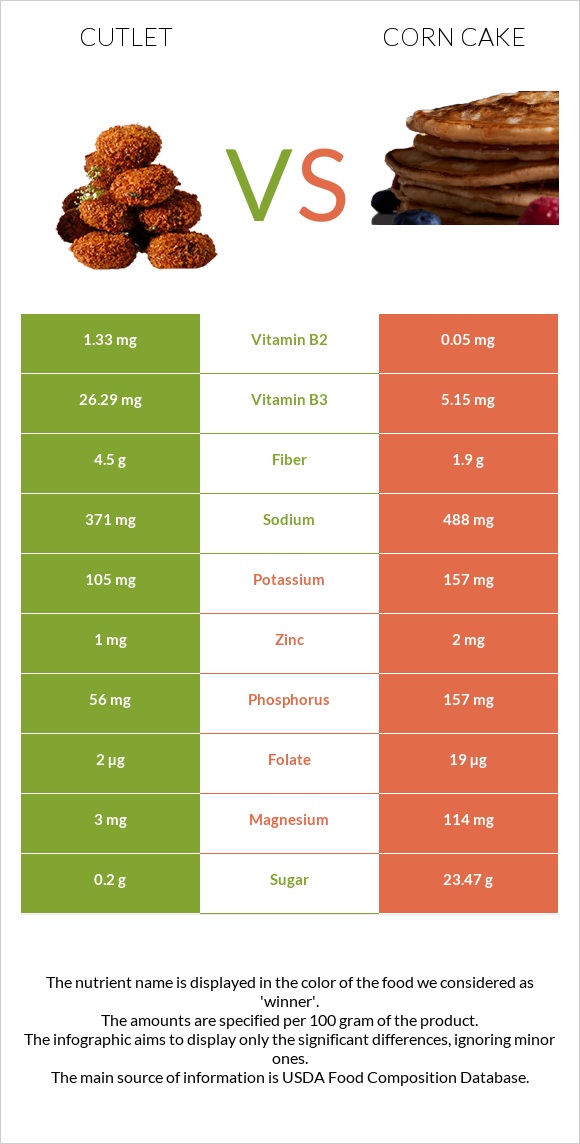
A recap on the differences between cutlet and corn cake Cutlet is higher in vitamin B3, vitamin B2, vitamin B6, and fiber, yet corn cake is higher in magnesium, vitamin B1, phosphorus, and zinc. Cutlet covers your daily vitamin B3 needs 132% more than corn cake. Cutlet contains 27 times more vitamin B2 than corn cake. While cutlet contains 1.33mg of vitamin B2, corn cake contains only 0.05mg. The amount of sodium in cutlet is lower. The glycemic index of cutlet is lower. Food varieties used in this article are WORTHINGTON Multigrain Cutlets, canned, unprepared and Snacks, corn cakes .
Infographic
Mineral Comparison
Mineral comparison score is based on the number of minerals by which one or the other food is richer. The "coverage" charts below show how much of the daily needs can be covered by 300 grams of the food.
3
100 g
300 g
2 slices - 92g
Magnesium
Magnesium
Calcium
Calcium
Potassium
Potassium
Iron
Iron
Copper
Copper
Zinc
Zinc
Phosphorus
Phosphorus
Sodium
Sodium
Manganese
Manganese
Selenium
Selenium
2.1%
6.6%
9.3%
64%
0%
27%
24%
48%
0%
0%
7
100 g
300 g
1 cake - 9g 2 cakes - 18g
Magnesium
Magnesium
Calcium
Calcium
Potassium
Potassium
Iron
Iron
Copper
Copper
Zinc
Zinc
Phosphorus
Phosphorus
Sodium
Sodium
Manganese
Manganese
Selenium
Selenium
81%
5.7%
14%
53%
140%
55%
67%
64%
237%
54%
Vitamin Comparison
Vitamin comparison score is based on the number of vitamins by which one or the other food is richer. The "coverage" charts below show how much of the daily needs can be covered by 300 grams of the food.
4
100 g
300 g
2 slices - 92g
Vitamin C
Vit. C
Vitamin D
Vit. D
Vitamin A
Vit. A
Vitamin E
Vit. E
Vitamin B1
Vit. B1
Vitamin B2
Vit. B2
Vitamin B3
Vit. B3
Vitamin B5
Vit. B5
Vitamin B6
Vit. B6
Vitamin B12
Vit. B12
Vitamin K
Vit. K
Folate
Folate
0%
0%
0%
362%
13%
307%
493%
0%
115%
0%
0%
1.5%
4
100 g
300 g
1 cake - 9g 2 cakes - 18g
Vitamin C
Vit. C
Vitamin D
Vit. D
Vitamin A
Vit. A
Vitamin E
Vit. E
Vitamin B1
Vit. B1
Vitamin B2
Vit. B2
Vitamin B3
Vit. B3
Vitamin B5
Vit. B5
Vitamin B6
Vit. B6
Vitamin B12
Vit. B12
Vitamin K
Vit. K
Folate
Folate
0%
0%
23%
0%
63%
12%
97%
50%
32%
0%
0%
14%
All nutrients comparison - raw data values
Nutrient
DV% diff.
Vitamin B3
26.29mg
5.15mg
132%
Vitamin E
18.09mg
121%
Vitamin B2
1.33mg
0.05mg
98%
Manganese
1.815mg
79%
Copper
0.42mg
47%
Protein
23.29g
8.1g
30%
Vitamin B6
0.5mg
0.14mg
28%
Magnesium
3mg
114mg
26%
Carbs
7.3g
83.4g
25%
Selenium
9.9µg
18%
Vitamin B1
0.05mg
0.25mg
17%
Vitamin B5
0.83mg
17%
Calories
117kcal
387kcal
14%
Phosphorus
56mg
157mg
14%
Fiber
4.5g
1.9g
10%
Zinc
1mg
2mg
9%
Vitamin A
70µg
8%
Sodium
371mg
488mg
5%
Iron
1.7mg
1.4mg
4%
Folate
2µg
19µg
4%
Potassium
105mg
157mg
2%
Fats
1.5g
2.4g
1%
Saturated fat
0.3g
0.42g
1%
Monounsaturated fat
0.2g
0.76g
1%
Polyunsaturated fat
0.8g
0.93g
1%
Protein per 100 calories
20g
2.1g
N/A
Calories per 10 g protein
50kcal
478kcal
N/A
Weight per 100 calories
85g
26g
N/A
Unsaturated / Saturated Fat ratio
3.3
4
N/A
Net carbs
2.8g
81.5g
N/A
Calcium
22mg
19mg
0%
Sugar
0.2g
23.47g
N/A
Tryptophan
0.081mg
0%
Threonine
0.301mg
0%
Isoleucine
0.316mg
0%
Leucine
0.837mg
0%
Lysine
0.267mg
0%
Methionine
0.177mg
0%
Phenylalanine
0.408mg
0%
Valine
0.442mg
0%
Histidine
0.227mg
0%
Macronutrient Comparison
Macronutrient breakdown side-by-side comparison
2
23%
7%
67%
Protein:
23.29 g
Fats:
1.5 g
Carbs:
7.3 g
Water:
66.69 g
Other:
1.22 g
3
8%
2%
83%
5%
Protein:
8.1 g
Fats:
2.4 g
Carbs:
83.4 g
Water:
4.6 g
Other:
1.5 g
Contains
more
Protein Protein
+187.5%
Contains
more
Water Water
+1349.8%
Contains
more
Fats Fats
+60%
Contains
more
Carbs Carbs
+1042.5%
Contains
more
Other Other
+23%
Fat Type Comparison
Fat type breakdown side-by-side comparison
1
23%
15%
62%
Saturated fat:
Sat. Fat
0.3 g
Monounsaturated fat:
Mono. Fat
0.2 g
Polyunsaturated fat:
Poly. Fat
0.8 g
2
20%
36%
44%
Saturated fat:
Sat. Fat
0.42 g
Monounsaturated fat:
Mono. Fat
0.76 g
Polyunsaturated fat:
Poly. Fat
0.93 g
Contains
less
Sat. Fat Saturated fat
-28.6%
Contains
more
Mono. Fat Monounsaturated fat
+280%
Contains
more
Poly. Fat Polyunsaturated fat
+16.3%