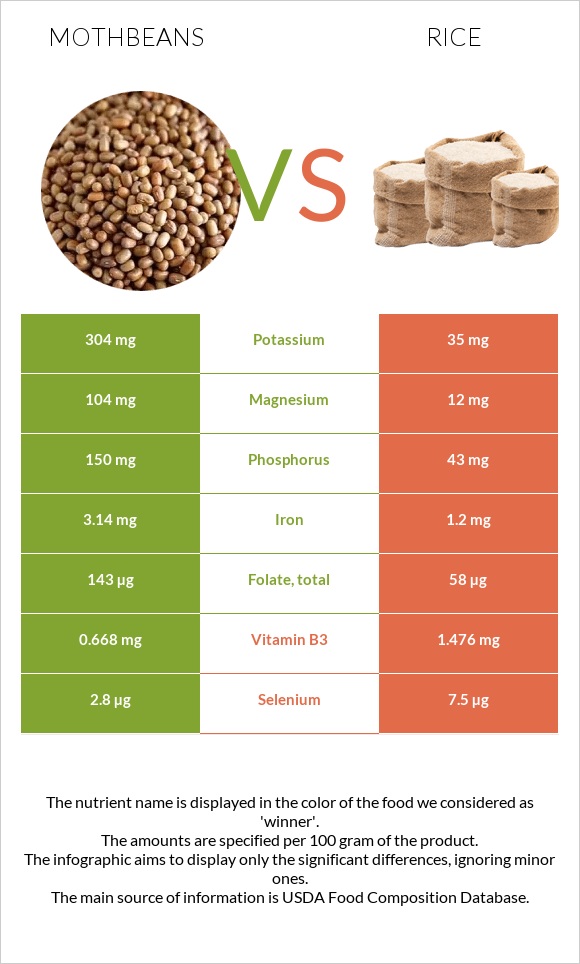
The main differences between mothbeans and rice Mothbeans is richer in iron, magnesium, folate, phosphorus, copper, and potassium, yet rice is richer in selenium and vitamin B3. Daily need coverage for iron for mothbeans is 24% higher. Mothbeans contains 9 times more potassium than rice. Mothbeans contains 304mg of potassium, while rice contains 35mg. Mothbeans has a lower glycemic index than rice. Food types used in this article are Mothbeans, mature seeds, cooked, boiled, without salt and Rice, white, long-grain, regular, enriched, cooked .
Infographic
Mineral Comparison
Mineral comparison score is based on the number of minerals by which one or the other food is richer. The "coverage" charts below show how much of the daily needs can be covered by 300 grams of the food.
7
100 g
300 g
1 cup - 177g
Magnesium
Magnesium
Calcium
Calcium
Potassium
Potassium
Iron
Iron
Copper
Copper
Zinc
Zinc
Phosphorus
Phosphorus
Sodium
Sodium
Manganese
Manganese
Selenium
Selenium
74%
0.9%
27%
118%
55%
16%
64%
1.3%
69%
15%
3
100 g
300 g
1 cup - 158g
Magnesium
Magnesium
Calcium
Calcium
Potassium
Potassium
Iron
Iron
Copper
Copper
Zinc
Zinc
Phosphorus
Phosphorus
Sodium
Sodium
Manganese
Manganese
Selenium
Selenium
8.6%
3%
3.1%
45%
23%
13%
18%
0.13%
62%
41%
Vitamin Comparison
Vitamin comparison score is based on the number of vitamins by which one or the other food is richer. The "coverage" charts below show how much of the daily needs can be covered by 300 grams of the food.
4
100 g
300 g
1 cup - 177g
Vitamin C
Vit. C
Vitamin D
Vit. D
Vitamin A
Vit. A
Vitamin E
Vit. E
Vitamin B1
Vit. B1
Vitamin B2
Vit. B2
Vitamin B3
Vit. B3
Vitamin B5
Vit. B5
Vitamin B6
Vit. B6
Vitamin B12
Vit. B12
Vitamin K
Vit. K
Folate
Folate
3.3%
0%
0.33%
0%
31%
5.3%
13%
23%
21%
0%
0%
107%
3
100 g
300 g
1 cup - 158g
Vitamin C
Vit. C
Vitamin D
Vit. D
Vitamin A
Vit. A
Vitamin E
Vit. E
Vitamin B1
Vit. B1
Vitamin B2
Vit. B2
Vitamin B3
Vit. B3
Vitamin B5
Vit. B5
Vitamin B6
Vit. B6
Vitamin B12
Vit. B12
Vitamin K
Vit. K
Folate
Folate
0%
0%
0%
0.8%
41%
3%
28%
23%
21%
0%
0%
44%
All nutrients comparison - raw data values
Nutrient
DV% diff.
Iron
3.14mg
1.2mg
24%
Magnesium
104mg
12mg
22%
Folate
143µg
58µg
21%
Phosphorus
150mg
43mg
15%
Copper
0.164mg
0.069mg
11%
Protein
7.81g
2.69g
10%
Selenium
2.8µg
7.5µg
9%
Potassium
304mg
35mg
8%
Vitamin B3
0.668mg
1.476mg
5%
Vitamin B1
0.124mg
0.163mg
3%
Carbs
20.96g
28.17g
2%
Fiber
0.4g
2%
Manganese
0.527mg
0.472mg
2%
Calories
117kcal
130kcal
1%
Vitamin C
1mg
0mg
1%
Calcium
3mg
10mg
1%
Zinc
0.59mg
0.49mg
1%
Vitamin B2
0.023mg
0.013mg
1%
Polyunsaturated fat
0.256g
0.076g
1%
Protein per 100 calories
6.7g
2.1g
N/A
Calories per 10 g protein
150kcal
483kcal
N/A
Weight per 100 calories
85g
77g
N/A
Fats
0.55g
0.28g
0%
Net carbs
20.96g
27.77g
N/A
Sugar
0.05g
N/A
Sodium
10mg
1mg
0%
Vitamin A
1µg
0µg
0%
Vitamin E
0.04mg
0%
Vitamin B5
0.391mg
0.39mg
0%
Vitamin B6
0.093mg
0.093mg
0%
Choline
2.1mg
0%
Saturated fat
0.124g
0.077g
0%
Monounsaturated fat
0.044g
0.088g
0%
Tryptophan
0.05mg
0.031mg
0%
Threonine
0.096mg
0%
Isoleucine
0.388mg
0.116mg
0%
Leucine
0.525mg
0.222mg
0%
Lysine
0.425mg
0.097mg
0%
Methionine
0.075mg
0.063mg
0%
Phenylalanine
0.35mg
0.144mg
0%
Valine
0.25mg
0.164mg
0%
Histidine
0.263mg
0.063mg
0%
Macronutrient Comparison
Macronutrient breakdown side-by-side comparison
4
8%
21%
69%
Protein:
7.81 g
Fats:
0.55 g
Carbs:
20.96 g
Water:
69.23 g
Other:
1.45 g
1
3%
28%
68%
Protein:
2.69 g
Fats:
0.28 g
Carbs:
28.17 g
Water:
68.44 g
Other:
0.42 g
Contains
more
Protein Protein
+190.3%
Contains
more
Fats Fats
+96.4%
Contains
more
Other Other
+245.2%
Contains
more
Carbs Carbs
+34.4%
Fat Type Comparison
Fat type breakdown side-by-side comparison
1
29%
10%
60%
Saturated fat:
Sat. Fat
0.124 g
Monounsaturated fat:
Mono. Fat
0.044 g
Polyunsaturated fat:
Poly. Fat
0.256 g
2
32%
37%
32%
Saturated fat:
Sat. Fat
0.077 g
Monounsaturated fat:
Mono. Fat
0.088 g
Polyunsaturated fat:
Poly. Fat
0.076 g
Contains
more
Poly. Fat Polyunsaturated fat
+236.8%
Contains
less
Sat. Fat Saturated fat
-37.9%
Contains
more
Mono. Fat Monounsaturated fat
+100%