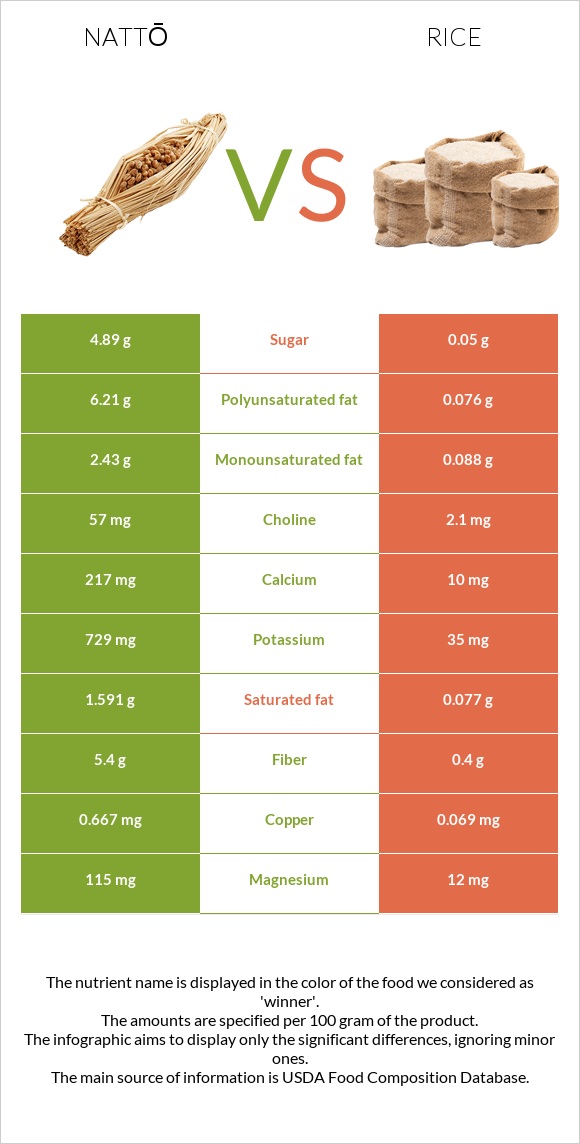
How are nattō and rice different? Nattō is higher than rice in iron, copper, manganese, magnesium, zinc, calcium, potassium, fiber, vitamin K, and phosphorus. Nattō covers your daily need for iron, 93% more than rice. Natto and Rice, white, long-grain, regular, enriched, cooked types were used in this article.
Infographic
Mineral Comparison
Mineral comparison score is based on the number of minerals by which one or the other food is richer. The "coverage" charts below show how much of the daily needs can be covered by 300 grams of the food.
9
100 g
300 g
1 cup - 175g
Magnesium
Magnesium
Calcium
Calcium
Potassium
Potassium
Iron
Iron
Copper
Copper
Zinc
Zinc
Phosphorus
Phosphorus
Sodium
Sodium
Manganese
Manganese
Selenium
Selenium
82%
65%
64%
323%
222%
83%
75%
0.91%
199%
48%
1
100 g
300 g
1 cup - 158g
Magnesium
Magnesium
Calcium
Calcium
Potassium
Potassium
Iron
Iron
Copper
Copper
Zinc
Zinc
Phosphorus
Phosphorus
Sodium
Sodium
Manganese
Manganese
Selenium
Selenium
8.6%
3%
3.1%
45%
23%
13%
18%
0.13%
62%
41%
Vitamin Comparison
Vitamin comparison score is based on the number of vitamins by which one or the other food is richer. The "coverage" charts below show how much of the daily needs can be covered by 300 grams of the food.
4
100 g
300 g
1 cup - 175g
Vitamin C
Vit. C
Vitamin D
Vit. D
Vitamin A
Vit. A
Vitamin E
Vit. E
Vitamin B1
Vit. B1
Vitamin B2
Vit. B2
Vitamin B3
Vit. B3
Vitamin B5
Vit. B5
Vitamin B6
Vit. B6
Vitamin B12
Vit. B12
Vitamin K
Vit. K
Folate
Folate
43%
0%
0%
0.2%
40%
44%
0%
13%
30%
0%
58%
6%
4
100 g
300 g
1 cup - 158g
Vitamin C
Vit. C
Vitamin D
Vit. D
Vitamin A
Vit. A
Vitamin E
Vit. E
Vitamin B1
Vit. B1
Vitamin B2
Vit. B2
Vitamin B3
Vit. B3
Vitamin B5
Vit. B5
Vitamin B6
Vit. B6
Vitamin B12
Vit. B12
Vitamin K
Vit. K
Folate
Folate
0%
0%
0%
0.8%
41%
3%
28%
23%
21%
0%
0%
44%
All nutrients comparison - raw data values
Nutrient
DV% diff.
Iron
8.6mg
1.2mg
93%
Copper
0.667mg
0.069mg
66%
Manganese
1.528mg
0.472mg
46%
Polyunsaturated fat
6.21g
0.076g
41%
Protein
19.4g
2.69g
33%
Magnesium
115mg
12mg
25%
Zinc
3.03mg
0.49mg
23%
Calcium
217mg
10mg
21%
Potassium
729mg
35mg
20%
Fiber
5.4g
0.4g
20%
Phosphorus
174mg
43mg
19%
Vitamin K
23.1µg
0µg
19%
Fats
11g
0.28g
16%
Vitamin C
13mg
0mg
14%
Vitamin B2
0.19mg
0.013mg
14%
Folate
8µg
58µg
13%
Choline
57mg
2.1mg
10%
Vitamin B3
0mg
1.476mg
9%
Saturated fat
1.591g
0.077g
7%
Monounsaturated fat
2.43g
0.088g
6%
Carbs
12.68g
28.17g
5%
Calories
211kcal
130kcal
4%
Vitamin B5
0.215mg
0.39mg
4%
Vitamin B6
0.13mg
0.093mg
3%
Selenium
8.8µg
7.5µg
2%
Protein per 100 calories
9.2g
2.1g
N/A
Calories per 10 g protein
109kcal
483kcal
N/A
Weight per 100 calories
47g
77g
N/A
Unsaturated / Saturated Fat ratio
5.4
2.1
N/A
Net carbs
7.28g
27.77g
N/A
Sugar
4.89g
0.05g
N/A
Sodium
7mg
1mg
0%
Vitamin E
0.01mg
0.04mg
0%
Vitamin B1
0.16mg
0.163mg
0%
Tryptophan
0.223mg
0.031mg
0%
Threonine
0.813mg
0.096mg
0%
Isoleucine
0.931mg
0.116mg
0%
Leucine
1.509mg
0.222mg
0%
Lysine
1.145mg
0.097mg
0%
Methionine
0.208mg
0.063mg
0%
Phenylalanine
0.941mg
0.144mg
0%
Valine
1.018mg
0.164mg
0%
Histidine
0.512mg
0.063mg
0%
Macronutrient Comparison
Macronutrient breakdown side-by-side comparison
3
19%
11%
13%
55%
2%
Protein:
19.4 g
Fats:
11 g
Carbs:
12.68 g
Water:
55.02 g
Other:
1.9 g
2
3%
28%
68%
Protein:
2.69 g
Fats:
0.28 g
Carbs:
28.17 g
Water:
68.44 g
Other:
0.42 g
Contains
more
Protein Protein
+621.2%
Contains
more
Fats Fats
+3828.6%
Contains
more
Other Other
+352.4%
Contains
more
Carbs Carbs
+122.2%
Contains
more
Water Water
+24.4%
Fat Type Comparison
Fat type breakdown side-by-side comparison
2
16%
24%
61%
Saturated fat:
Sat. Fat
1.591 g
Monounsaturated fat:
Mono. Fat
2.43 g
Polyunsaturated fat:
Poly. Fat
6.21 g
1
32%
37%
32%
Saturated fat:
Sat. Fat
0.077 g
Monounsaturated fat:
Mono. Fat
0.088 g
Polyunsaturated fat:
Poly. Fat
0.076 g
Contains
more
Mono. Fat Monounsaturated fat
+2661.4%
Contains
more
Poly. Fat Polyunsaturated fat
+8071.1%
Contains
less
Sat. Fat Saturated fat
-95.2%