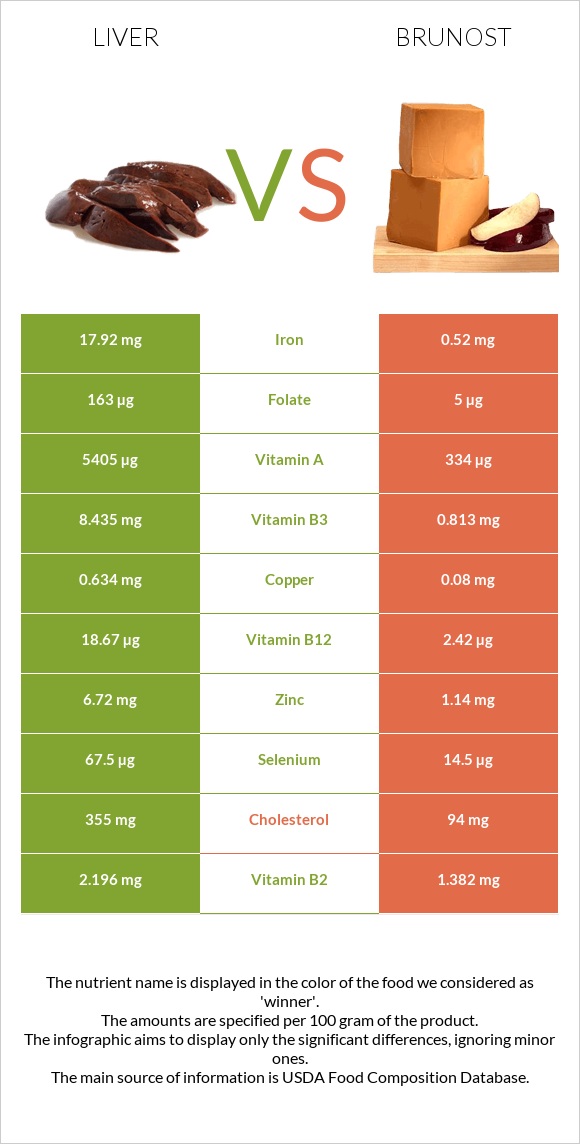
Important differences between liver and brunost Liver has more vitamin B12, vitamin A, iron, selenium, vitamin B2, copper, zinc, and vitamin B3 than brunost. Liver's daily need coverage for vitamin B12 is 677% more. Liver contains 34 times more iron than brunost. Liver contains 17.92mg of iron, while brunost contains 0.52mg. Brunost contains less cholesterol. Brunost has a higher glycemic index. The glycemic index of brunost is 27, while the glycemic index of liver is 0. The food varieties used in the comparison are Pork, fresh, variety meats, and by-products, liver, cooked, braised and Cheese, gjetost .
Infographic
Mineral Comparison
Mineral comparison score is based on the number of minerals by which one or the other food is richer. The "coverage" charts below show how much of the daily needs can be covered by 300 grams of the food.
6
100 g
300 g
3 oz - 85g
Magnesium
Magnesium
Calcium
Calcium
Potassium
Potassium
Iron
Iron
Copper
Copper
Zinc
Zinc
Phosphorus
Phosphorus
Sodium
Sodium
Manganese
Manganese
Selenium
Selenium
10%
3%
13%
672%
211%
183%
103%
6.4%
39%
368%
4
100 g
300 g
1 oz - 28.35g 1 package (8 oz) - 227g
Magnesium
Magnesium
Calcium
Calcium
Potassium
Potassium
Iron
Iron
Copper
Copper
Zinc
Zinc
Phosphorus
Phosphorus
Sodium
Sodium
Manganese
Manganese
Selenium
Selenium
50%
120%
124%
20%
27%
31%
190%
78%
5.2%
79%
Vitamin Comparison
Vitamin comparison score is based on the number of vitamins by which one or the other food is richer. The "coverage" charts below show how much of the daily needs can be covered by 300 grams of the food.
8
100 g
300 g
3 oz - 85g
Vitamin C
Vit. C
Vitamin D
Vit. D
Vitamin A
Vit. A
Vitamin E
Vit. E
Vitamin B1
Vit. B1
Vitamin B2
Vit. B2
Vitamin B3
Vit. B3
Vitamin B5
Vit. B5
Vitamin B6
Vit. B6
Vitamin B12
Vit. B12
Vitamin K
Vit. K
Folate
Folate
79%
0%
1802%
0%
65%
507%
158%
286%
132%
2334%
0%
122%
1
100 g
300 g
1 oz - 28.35g 1 package (8 oz) - 227g
Vitamin C
Vit. C
Vitamin D
Vit. D
Vitamin A
Vit. A
Vitamin E
Vit. E
Vitamin B1
Vit. B1
Vitamin B2
Vit. B2
Vitamin B3
Vit. B3
Vitamin B5
Vit. B5
Vitamin B6
Vit. B6
Vitamin B12
Vit. B12
Vitamin K
Vit. K
Folate
Folate
0%
0%
111%
0%
79%
319%
15%
201%
63%
303%
0%
3.8%
All nutrients comparison - raw data values
Nutrient
DV% diff.
Vitamin B12
18.67µg
2.42µg
677%
Vitamin A
5405µg
334µg
563%
Iron
17.92mg
0.52mg
218%
Selenium
67.5µg
14.5µg
96%
Cholesterol
355mg
94mg
87%
Saturated fat
1.41g
19.16g
81%
Vitamin B2
2.196mg
1.382mg
63%
Copper
0.634mg
0.08mg
62%
Zinc
6.72mg
1.14mg
51%
Vitamin B3
8.435mg
0.813mg
48%
Folate
163µg
5µg
40%
Fats
4.4g
29.51g
39%
Calcium
10mg
400mg
39%
Potassium
150mg
1409mg
37%
Protein
26.02g
9.65g
33%
Phosphorus
241mg
444mg
29%
Vitamin B5
4.774mg
3.351mg
28%
Vitamin C
23.6mg
0mg
26%
Sodium
49mg
600mg
24%
Vitamin B6
0.57mg
0.271mg
23%
Monounsaturated fat
0.63g
7.879g
18%
Calories
165kcal
466kcal
15%
Carbs
3.76g
42.65g
13%
Magnesium
14mg
70mg
13%
Manganese
0.3mg
0.04mg
11%
Vitamin B1
0.258mg
0.315mg
5%
Polyunsaturated fat
1.05g
0.938g
1%
Protein per 100 calories
16g
2.1g
N/A
Calories per 10 g protein
63kcal
483kcal
N/A
Weight per 100 calories
61g
21g
N/A
Unsaturated / Saturated Fat ratio
1.2
0.46
N/A
Net carbs
3.76g
42.65g
N/A
Tryptophan
0.366mg
0.135mg
0%
Threonine
1.107mg
0.393mg
0%
Isoleucine
1.32mg
0.519mg
0%
Leucine
2.319mg
0.992mg
0%
Lysine
2.007mg
0.814mg
0%
Methionine
0.645mg
0.318mg
0%
Phenylalanine
1.274mg
0.54mg
0%
Valine
1.607mg
0.765mg
0%
Histidine
0.708mg
0.293mg
0%
Omega-3 - DHA
0.03g
N/A
Omega-3 - DPA
0.04g
N/A
Macronutrient Comparison
Macronutrient breakdown side-by-side comparison
2
26%
4%
4%
64%
Protein:
26.02 g
Fats:
4.4 g
Carbs:
3.76 g
Water:
64.32 g
Other:
1.5 g
3
10%
30%
43%
13%
5%
Protein:
9.65 g
Fats:
29.51 g
Carbs:
42.65 g
Water:
13.44 g
Other:
4.75 g
Contains
more
Protein Protein
+169.6%
Contains
more
Water Water
+378.6%
Contains
more
Fats Fats
+570.7%
Contains
more
Carbs Carbs
+1034.3%
Contains
more
Other Other
+216.7%
Fat Type Comparison
Fat type breakdown side-by-side comparison
2
46%
20%
34%
Saturated fat:
Sat. Fat
1.41 g
Monounsaturated fat:
Mono. Fat
0.63 g
Polyunsaturated fat:
Poly. Fat
1.05 g
1
68%
28%
3%
Saturated fat:
Sat. Fat
19.16 g
Monounsaturated fat:
Mono. Fat
7.879 g
Polyunsaturated fat:
Poly. Fat
0.938 g
Contains
less
Sat. Fat Saturated fat
-92.6%
Contains
more
Poly. Fat Polyunsaturated fat
+11.9%
Contains
more
Mono. Fat Monounsaturated fat
+1150.6%