Reesesticks vs. Mr. Goodbar — In-Depth Nutrition Comparison
Compare
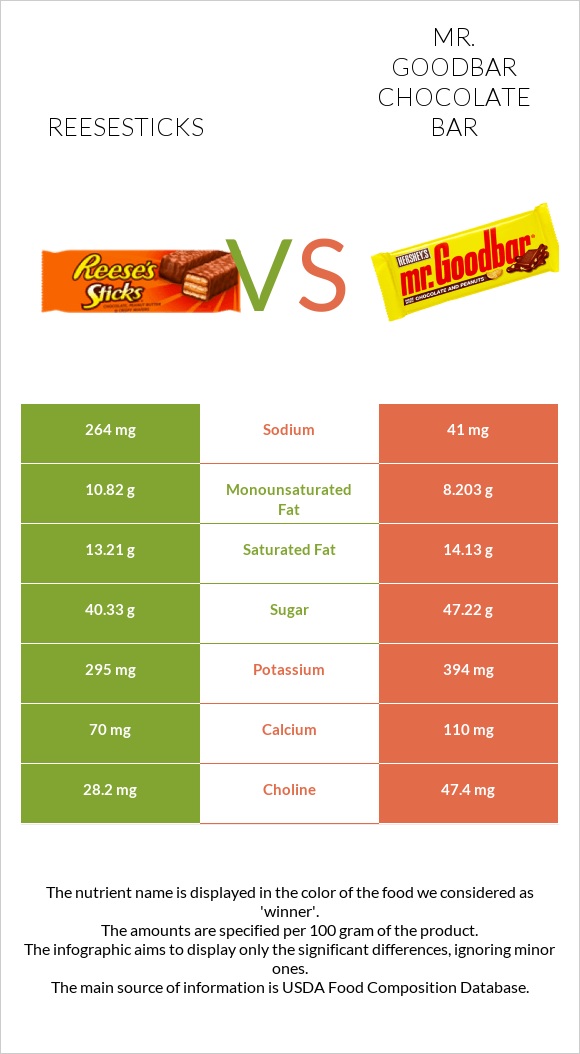
Important differences between reesesticks and mr. Goodbar
- Reesesticks have more monounsaturated fat; however, mr. Goodbar has more vitamin B12.
- Mr. Goodbar is lower in sodium.
The food varieties used in the comparison are Candies, HERSHEY, REESESTICKS crispy wafers, peanut butter, milk chocolate and Candies, MR. GOODBAR Chocolate Bar.
Infographic
Infographic link
Mineral Comparison
Mineral comparison score is based on the number of minerals by which one or the other food is richer. The "coverage" charts below show how much of the daily needs can be covered by 300 grams of the food.
| Contains more CopperCopper | +17.6% |
| Contains more SeleniumSelenium | +∞% |
| Contains more CalciumCalcium | +57.1% |
| Contains more PotassiumPotassium | +33.6% |
| Contains more PhosphorusPhosphorus | +13.2% |
| Contains less SodiumSodium | -84.5% |
Vitamin Comparison
Vitamin comparison score is based on the number of vitamins by which one or the other food is richer. The "coverage" charts below show how much of the daily needs can be covered by 300 grams of the food.
| Contains more Vitamin B6Vitamin B6 | +14.3% |
| Contains more Vitamin KVitamin K | +63.9% |
| Contains more Vitamin CVitamin C | +50% |
| Contains more Vitamin AVitamin A | +150% |
| Contains more Vitamin EVitamin E | +14.4% |
| Contains more Vitamin B2Vitamin B2 | +40% |
| Contains more Vitamin B12Vitamin B12 | +120% |
All nutrients comparison - raw data values
| Nutrient |  |
 |
DV% diff. |
| Sodium | 264mg | 41mg | 10% |
| Vitamin B12 | 0.15µg | 0.33µg | 8% |
| Monounsaturated fat | 10.82g | 8.203g | 7% |
| Caffeine | 0mg | 18mg | 5% |
| Calcium | 70mg | 110mg | 4% |
| Saturated fat | 13.21g | 14.13g | 4% |
| Fats | 31.34g | 33.21g | 3% |
| Potassium | 295mg | 394mg | 3% |
| Copper | 0.2mg | 0.17mg | 3% |
| Phosphorus | 144mg | 163mg | 3% |
| Vitamin E | 2.77mg | 3.17mg | 3% |
| Vitamin B2 | 0.1mg | 0.14mg | 3% |
| Choline | 28.2mg | 47.4mg | 3% |
| Fiber | 3.3g | 3.8g | 2% |
| Vitamin A | 14µg | 35µg | 2% |
| Vitamin K | 5.9µg | 3.6µg | 2% |
| Polyunsaturated fat | 4.68g | 4.366g | 2% |
| Calories | 521kcal | 538kcal | 1% |
| Protein | 9.53g | 10.22g | 1% |
| Cholesterol | 6mg | 10mg | 1% |
| Iron | 1.3mg | 1.39mg | 1% |
| Zinc | 0.99mg | 0.93mg | 1% |
| Selenium | 0.7µg | 0µg | 1% |
| Vitamin B1 | 0.13mg | 0.14mg | 1% |
| Vitamin B3 | 3.64mg | 3.44mg | 1% |
| Vitamin B6 | 0.08mg | 0.07mg | 1% |
| Folate | 40µg | 38µg | 1% |
| Vitamin C | 0.6mg | 0.9mg | 0% |
| Net carbs | 52.08g | 50.54g | N/A |
| Carbs | 55.38g | 54.34g | 0% |
| Magnesium | 49mg | 47mg | 0% |
| Sugar | 40.33g | 47.22g | N/A |
| Vitamin B5 | 0.44mg | 0.42mg | 0% |
Macronutrient Comparison
Macronutrient breakdown side-by-side comparison
Protein:
9.53 g
Fats:
31.34 g
Carbs:
55.38 g
Water:
1.6 g
Other:
2.15 g
Protein:
10.22 g
Fats:
33.21 g
Carbs:
54.34 g
Water:
0.45 g
Other:
1.78 g
| Contains more WaterWater | +255.6% |
| Contains more OtherOther | +20.8% |
~equal in
Protein
~10.22g
~equal in
Fats
~33.21g
~equal in
Carbs
~54.34g
Fat Type Comparison
Fat type breakdown side-by-side comparison
Saturated fat:
Sat. Fat
13.21 g
Monounsaturated fat:
Mono. Fat
10.82 g
Polyunsaturated fat:
Poly. Fat
4.68 g
Saturated fat:
Sat. Fat
14.13 g
Monounsaturated fat:
Mono. Fat
8.203 g
Polyunsaturated fat:
Poly. Fat
4.366 g
| Contains more Mono. FatMonounsaturated fat | +31.9% |
~equal in
Saturated fat
~14.13g
~equal in
Polyunsaturated fat
~4.366g


