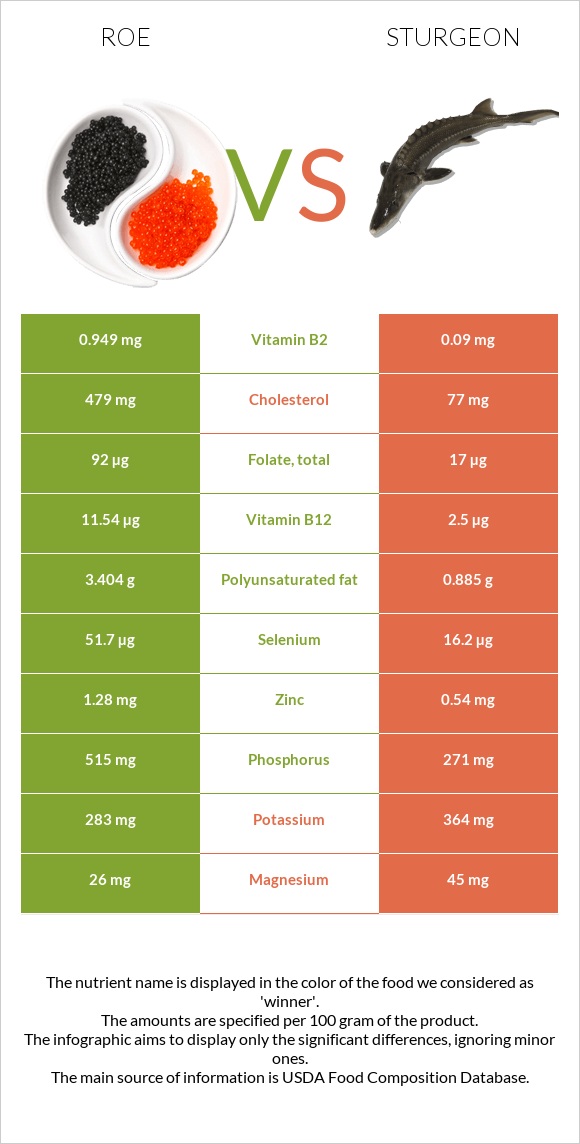
Important differences between roe and sturgeon Roe has more vitamin B12, vitamin B2, selenium, phosphorus, folate, vitamin C, and vitamin B1; however, sturgeon has more vitamin B3 and vitamin A. Roe's daily need coverage for vitamin B12 is 377% more. Sturgeon is lower in cholesterol. Roe has a higher glycemic index than sturgeon. The food varieties used in the comparison are Fish, roe, mixed species, cooked, dry heat and Fish, sturgeon, mixed species, cooked, dry heat .
Infographic
Mineral Comparison
Mineral comparison score is based on the number of minerals by which one or the other food is richer. The "coverage" charts below show how much of the daily needs can be covered by 300 grams of the food.
5
100 g
300 g
1 oz - 28.35g 3 oz - 85g
Magnesium
Magnesium
Calcium
Calcium
Potassium
Potassium
Iron
Iron
Copper
Copper
Zinc
Zinc
Phosphorus
Phosphorus
Sodium
Sodium
Manganese
Manganese
Selenium
Selenium
19%
8.4%
25%
29%
43%
35%
221%
15%
1.7%
282%
5
100 g
300 g
1 cubic inch, boneless - 17g 1 oz, boneless - 28.35g 3 oz - 85g 1 cup, cooked - 136g 1 piece (4-1/2" x 2-1/8" x 7/8") - 145g
Magnesium
Magnesium
Calcium
Calcium
Potassium
Potassium
Iron
Iron
Copper
Copper
Zinc
Zinc
Phosphorus
Phosphorus
Sodium
Sodium
Manganese
Manganese
Selenium
Selenium
32%
5.1%
32%
34%
18%
15%
116%
9%
3.9%
88%
Vitamin Comparison
Vitamin comparison score is based on the number of vitamins by which one or the other food is richer. The "coverage" charts below show how much of the daily needs can be covered by 300 grams of the food.
6
100 g
300 g
1 oz - 28.35g 3 oz - 85g
Vitamin C
Vit. C
Vitamin D
Vit. D
Vitamin A
Vit. A
Vitamin E
Vit. E
Vitamin B1
Vit. B1
Vitamin B2
Vit. B2
Vitamin B3
Vit. B3
Vitamin B5
Vit. B5
Vitamin B6
Vit. B6
Vitamin B12
Vit. B12
Vitamin K
Vit. K
Folate
Folate
55%
0%
30%
0%
69%
219%
41%
69%
43%
1443%
0%
69%
6
100 g
300 g
1 cubic inch, boneless - 17g 1 oz, boneless - 28.35g 3 oz - 85g 1 cup, cooked - 136g 1 piece (4-1/2" x 2-1/8" x 7/8") - 145g
Vitamin C
Vit. C
Vitamin D
Vit. D
Vitamin A
Vit. A
Vitamin E
Vit. E
Vitamin B1
Vit. B1
Vitamin B2
Vit. B2
Vitamin B3
Vit. B3
Vitamin B5
Vit. B5
Vitamin B6
Vit. B6
Vitamin B12
Vit. B12
Vitamin K
Vit. K
Folate
Folate
0%
194%
88%
13%
20%
21%
189%
52%
53%
313%
0.25%
13%
All nutrients comparison - raw data values
Nutrient
DV% diff.
Vitamin B12
11.54µg
2.5µg
377%
Cholesterol
479mg
77mg
134%
Vitamin B2
0.949mg
0.09mg
66%
Vitamin D
12.9µg
65%
Selenium
51.7µg
16.2µg
65%
Vitamin D*
515 IU
64%
Vitamin B3
2.192mg
10.1mg
49%
Phosphorus
515mg
271mg
35%
Vitamin A
91µg
263µg
19%
Folate
92µg
17µg
19%
Vitamin C
16.4mg
0mg
18%
Polyunsaturated fat
3.404g
0.885g
17%
Protein
28.62g
20.7g
16%
Vitamin B1
0.277mg
0.08mg
16%
Choline
70mg
13%
Copper
0.128mg
0.053mg
8%
Zinc
1.28mg
0.54mg
7%
Vitamin B5
1.154mg
0.87mg
6%
Fats
8.23g
5.18g
5%
Magnesium
26mg
45mg
5%
Vitamin E
0.63mg
4%
Calories
204kcal
135kcal
3%
Vitamin B6
0.185mg
0.23mg
3%
Saturated fat
1.866g
1.173g
3%
Potassium
283mg
364mg
2%
Iron
0.77mg
0.9mg
2%
Sodium
117mg
69mg
2%
Carbs
1.92g
0g
1%
Calcium
28mg
17mg
1%
Manganese
0.013mg
0.03mg
1%
Monounsaturated fat
2.129g
2.486g
1%
Protein per 100 calories
14g
15g
N/A
Calories per 10 g protein
71kcal
65kcal
N/A
Weight per 100 calories
49g
74g
N/A
Unsaturated / Saturated Fat ratio
3
2.9
N/A
Net carbs
1.92g
0g
N/A
Vitamin K
0.1µg
0%
Tryptophan
0.375mg
0.232mg
0%
Threonine
1.305mg
0.907mg
0%
Isoleucine
1.465mg
0.954mg
0%
Leucine
2.509mg
1.682mg
0%
Lysine
2.179mg
1.901mg
0%
Methionine
0.71mg
0.613mg
0%
Phenylalanine
1.401mg
0.808mg
0%
Valine
1.676mg
1.066mg
0%
Histidine
0.778mg
0.609mg
0%
Omega-3 - EPA
1.26g
0.249g
N/A
Omega-3 - DHA
1.747g
0.119g
N/A
Omega-3 - DPA
0.105g
0.058g
N/A
Macronutrient Comparison
Macronutrient breakdown side-by-side comparison
3
29%
8%
2%
59%
3%
Protein:
28.62 g
Fats:
8.23 g
Carbs:
1.92 g
Water:
58.63 g
Other:
2.6 g
2
21%
5%
70%
4%
Protein:
20.7 g
Fats:
5.18 g
Carbs:
0 g
Water:
69.94 g
Other:
4.18 g
Contains
more
Protein Protein
+38.3%
Contains
more
Fats Fats
+58.9%
Contains
more
Carbs Carbs
+∞%
Contains
more
Water Water
+19.3%
Contains
more
Other Other
+60.8%
Fat Type Comparison
Fat type breakdown side-by-side comparison
1
25%
29%
46%
Saturated fat:
Sat. Fat
1.866 g
Monounsaturated fat:
Mono. Fat
2.129 g
Polyunsaturated fat:
Poly. Fat
3.404 g
2
26%
55%
19%
Saturated fat:
Sat. Fat
1.173 g
Monounsaturated fat:
Mono. Fat
2.486 g
Polyunsaturated fat:
Poly. Fat
0.885 g
Contains
more
Poly. Fat Polyunsaturated fat
+284.6%
Contains
less
Sat. Fat Saturated fat
-37.1%
Contains
more
Mono. Fat Monounsaturated fat
+16.8%