Yellowtail vs. Burbot — In-Depth Nutrition Comparison
Compare
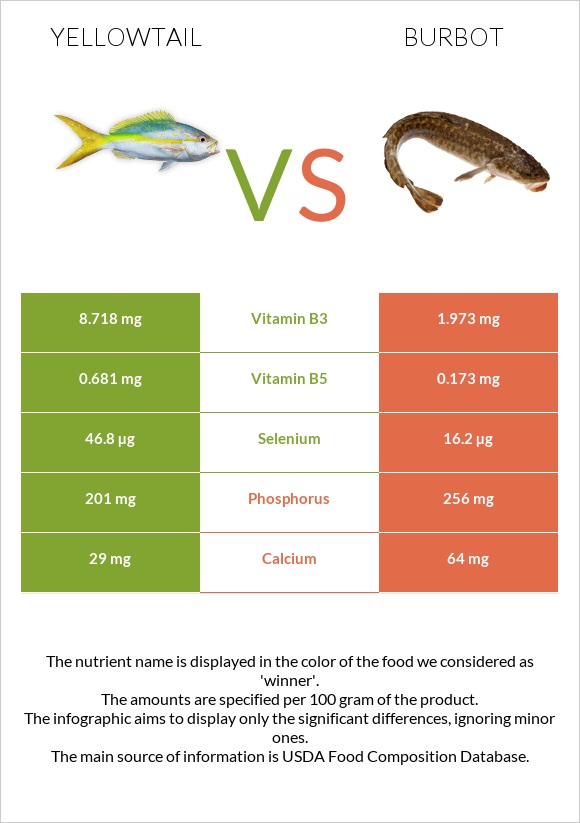
A recap on the differences between yellowtail and burbot
- Yellowtail has more selenium, vitamin B3, vitamin B12, and vitamin B5; however, burbot is higher in manganese, copper, vitamin B1, vitamin B6, vitamin B2, and phosphorus.
- Yellowtail covers your daily selenium needs 56% more than burbot.
- Burbot contains 4 times less vitamin B3 than yellowtail. Yellowtail contains 8.718mg of vitamin B3, while burbot contains 1.973mg.
Food varieties used in this article are Fish, yellowtail, mixed species, cooked, dry heat and Fish, burbot, cooked, dry heat.
Infographic
Infographic link
Mineral Comparison
Mineral comparison score is based on the number of minerals by which one or the other food is richer. The "coverage" charts below show how much of the daily needs can be covered by 300 grams of the food.
| Contains less SodiumSodium | -59.7% |
| Contains more SeleniumSelenium | +188.9% |
| Contains more CalciumCalcium | +120.7% |
| Contains more IronIron | +82.5% |
| Contains more CopperCopper | +341.4% |
| Contains more ZincZinc | +44.8% |
| Contains more PhosphorusPhosphorus | +27.4% |
| Contains more ManganeseManganese | +4621.1% |
Vitamin Comparison
Vitamin comparison score is based on the number of vitamins by which one or the other food is richer. The "coverage" charts below show how much of the daily needs can be covered by 300 grams of the food.
| Contains more Vitamin CVitamin C | +∞% |
| Contains more Vitamin AVitamin A | +520% |
| Contains more Vitamin B3Vitamin B3 | +341.9% |
| Contains more Vitamin B5Vitamin B5 | +293.6% |
| Contains more Vitamin B12Vitamin B12 | +35.9% |
| Contains more FolateFolate | +300% |
| Contains more Vitamin B1Vitamin B1 | +145.1% |
| Contains more Vitamin B2Vitamin B2 | +237.3% |
| Contains more Vitamin B6Vitamin B6 | +87% |
All nutrients comparison - raw data values
| Nutrient |  |
 |
DV% diff. |
| Selenium | 46.8µg | 16.2µg | 56% |
| Vitamin B3 | 8.718mg | 1.973mg | 42% |
| Manganese | 0.019mg | 0.897mg | 38% |
| Copper | 0.058mg | 0.256mg | 22% |
| Vitamin B1 | 0.175mg | 0.429mg | 21% |
| Vitamin B12 | 1.25µg | 0.92µg | 14% |
| Vitamin B6 | 0.185mg | 0.346mg | 12% |
| Protein | 29.67g | 24.76g | 10% |
| Vitamin B5 | 0.681mg | 0.173mg | 10% |
| Fats | 6.72g | 1.04g | 9% |
| Vitamin B2 | 0.051mg | 0.172mg | 9% |
| Phosphorus | 201mg | 256mg | 8% |
| Iron | 0.63mg | 1.15mg | 7% |
| Calories | 187kcal | 115kcal | 4% |
| Calcium | 29mg | 64mg | 4% |
| Vitamin C | 2.9mg | 0mg | 3% |
| Zinc | 0.67mg | 0.97mg | 3% |
| Sodium | 50mg | 124mg | 3% |
| Vitamin A | 31µg | 5µg | 3% |
| Polyunsaturated fat | 0.381g | 3% | |
| Cholesterol | 71mg | 77mg | 2% |
| Magnesium | 38mg | 41mg | 1% |
| Potassium | 538mg | 518mg | 1% |
| Folate | 4µg | 1µg | 1% |
| Saturated fat | 0.209g | 1% | |
| Monounsaturated fat | 0.17g | 0% | |
| Tryptophan | 0.332mg | 0.277mg | 0% |
| Threonine | 1.301mg | 1.085mg | 0% |
| Isoleucine | 1.367mg | 1.141mg | 0% |
| Leucine | 2.411mg | 2.012mg | 0% |
| Lysine | 2.725mg | 2.274mg | 0% |
| Methionine | 0.878mg | 0.733mg | 0% |
| Phenylalanine | 1.158mg | 0.966mg | 0% |
| Valine | 1.528mg | 1.275mg | 0% |
| Histidine | 0.873mg | 0.729mg | 0% |
| Omega-3 - EPA | 0.09g | N/A | |
| Omega-3 - DHA | 0.123g | N/A | |
| Omega-3 - DPA | 0.033g | N/A |
Macronutrient Comparison
Macronutrient breakdown side-by-side comparison
Protein:
29.67 g
Fats:
6.72 g
Carbs:
0 g
Water:
67.33 g
Other:
0 g
Protein:
24.76 g
Fats:
1.04 g
Carbs:
0 g
Water:
73.41 g
Other:
0.79 g
| Contains more ProteinProtein | +19.8% |
| Contains more FatsFats | +546.2% |
| Contains more OtherOther | +∞% |
~equal in
Carbs
~0g
~equal in
Water
~73.41g


