Barbecue sauce nutrition: calories, carbs, GI, protein, fiber, fats
Carbs in Barbecue sauce
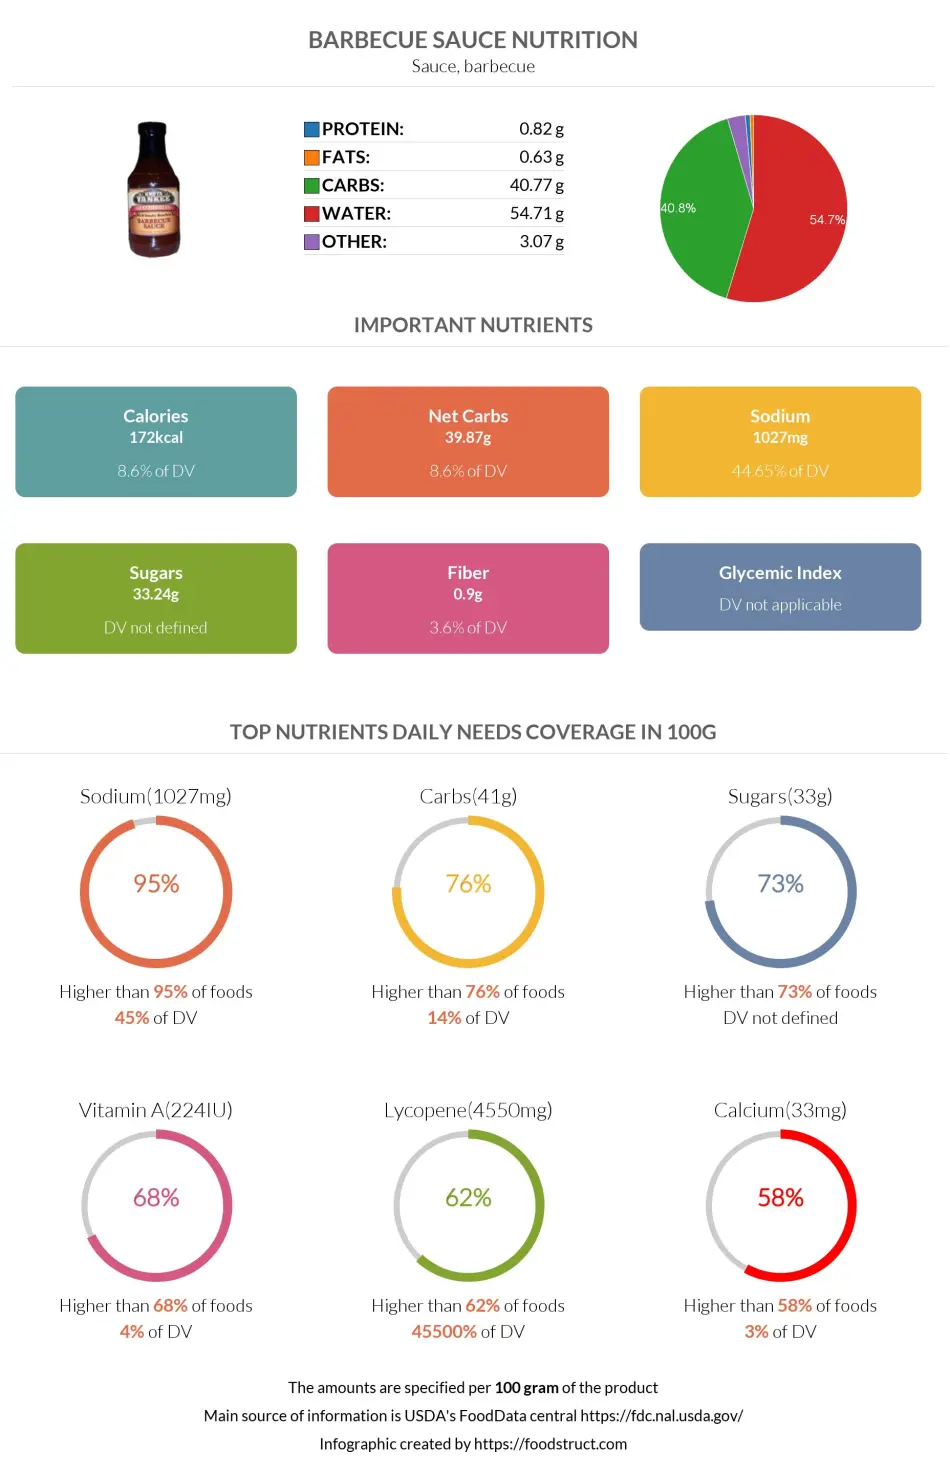
Barbecue sauce is mostly made up of carbs. 40% of its macronutrient composition is carbs, and 54% of it is water. The remaining 6% is distributed among fat and protein.
Macronutrients chart
Barbecue sauce provides 14% of DV of carbs, equalling 40.8 grams per 100g. It is higher in carbs than 76% of foods.
Carbs per serving size
The serving size for Barbecue sauce is one tablespoon, equalling 17 grams. One serving of the sauce provides 6.9g of carbs.
Carbohydrate type breakdown
The majority of carbs in Barbecue sauce are sugars. The sugar content of it is divided into glucose (16.4g), fructose (14.2g), sucrose (2.7g), and starch (0.4g).
Carbohydrate type breakdown
Net carbs in Barbecue sauce
0.9 grams of overall carbs in Barbecue sauce are fibers. Therefore, the net carb content of this food equals 39.9 grams.
Fiber content ratio for Barbecue sauce
COMPARISON
According to our database, Barbecue sauce contains more carbs than other sauces.
| Food | Carbs per serving | Carbs per 100g |
| Barbecue sauce | 6.9g (18g) | 40.8g |
| Hot sauce | 0.1g (4.7g) | 1.8g |
| Fish sauce | 0.7g (18g) | 3.6g |

Top nutrition facts for Barbecue sauce
| Calories ⓘ Calories for selected serving | 172 kcal |
| Glycemic load ⓘ Glycemic Load (GL) is a metric that measures both the quality (Glycemic Index) and quantity of carbohydrates in a specific serving of food to estimate its impact on blood sugar levels. It is calculated as: (GI × Carbs in grams) / 100. | 0 (low) |
| Net carbs ⓘ Net Carbs = Total Carbohydrates – Fiber – Sugar Alcohols | 40 g |
| Default serving size ⓘ Serving sizes are mostly taken from FDA's Reference Amounts Customarily Consumed (RACCs) | 1 tbsp (17 g) |
| Acidity (Based on PRAL) ⓘ PRAL (Potential renal acid load) is calculated using a formula. On the PRAL scale the higher the positive value, the more is the acidifying effect on the body. The lower the negative value, the higher the alkalinity of the food. 0 is neutral. | -4.5 (alkaline) |
| Oxalates | 6.8 mg ⓘ https://www.hsph.harvard.edu/nutrition-questionnaire-service-center/nutrient-tables-download-page/ |
Barbecue sauce calories (kcal)
| Calories for different serving sizes of barbecue sauce | Calories | Weight |
|---|---|---|
| Calories in 100 grams | 172 | |
| Calories in 1 tbsp | 29 | 17 g |
| Calories in 0.5 cup | 246 | 143 g |
| Calories in 1 cup | 480 | 279 g |
| Calories for different varieties of barbecue sauce | Calories | Weight |
|---|---|---|
| Sauce, barbecue (this food) | 172 | 100 g |
| Sauce, barbecue, OPEN PIT, original | 132 | 100 g |
| Sauce, barbecue, KC MASTERPIECE, original | 160 | 100 g |
| Sauce, barbecue, BULL'S-EYE, original | 170 | 100 g |
| Sauce, barbecue, SWEET BABY RAY'S, original | 192 | 100 g |
Extra Nutrition facts for Barbecue sauce
| Weight per 100 calories ⓘ Shows how many grams of this food equal 100 kcal—higher grams mean a larger portion for the same calories. | 58 g |
Mineral coverage chart
Mineral chart - relative view
Vitamin coverage chart
Vitamin chart - relative view
Fat type information
All nutrients for Barbecue sauce per 100g
| Nutrient | Value | DV% | In TOP % of foods | Comparison |
| Vitamin A | 11µg | 1% | 33% | |
| Calories | 172kcal | 9% | 55% |
3.7 times more than Orange
|
| Protein | 0.82g | 2% | 87% |
3.4 times less than Broccoli
|
| Weight per 100 calories | 58g | N/A | 46% | |
| Fats | 0.63g | 1% | 79% |
52.9 times less than Cheese
|
| Vitamin C | 0.6mg | 1% | 37% |
88.3 times less than Lemon
|
| Carbs | 41g | 14% | 24% |
1.4 times more than Rice
|
| Net carbs | 40g | N/A | 23% |
1.4 times less than Chocolate
|
| Cholesterol | 0mg | 0% | 100% |
N/A
|
| Vitamin D* | 0 IU | 0% | 100% |
N/A
|
| Vitamin D | 0µg | 0% | 100% |
N/A
|
| Magnesium | 13mg | 3% | 69% |
10.8 times less than Almonds
|
| Calcium | 33mg | 3% | 39% |
3.8 times less than Milk
|
| Potassium | 232mg | 7% | 47% |
1.6 times more than Cucumber
|
| Iron | 0.64mg | 8% | 71% |
4.1 times less than Beef broiled
|
| Sugar | 33g | N/A | 7% |
3.7 times more than Coca-Cola
|
| Fiber | 0.9g | 4% | 45% |
2.7 times less than Orange
|
| Copper | 0.07mg | 8% | 54% |
2 times less than Shiitake
|
| Zinc | 0.17mg | 2% | 79% |
37.1 times less than Beef broiled
|
| Starch | 0.35g | 0% | 11% |
43.7 times less than Potato
|
| Phosphorus | 20mg | 3% | 82% |
9.1 times less than Chicken meat
|
| Sodium | 1027mg | 45% | 5% |
2.1 times more than White bread
|
| Vitamin E | 0.8mg | 5% | 17% |
1.8 times less than Kiwi
|
| Manganese | 0.13mg | 5% | 34% | |
| Selenium | 1.3µg | 2% | 61% | |
| Vitamin B1 | 0.02mg | 2% | 79% |
11.6 times less than Pea raw
|
| Vitamin B2 | 0.06mg | 4% | 73% |
2.3 times less than Avocado
|
| Vitamin B3 | 0.6mg | 4% | 69% |
16 times less than Turkey meat
|
| Vitamin B5 | 0.16mg | 3% | 59% |
6.9 times less than Sunflower seeds
|
| Vitamin B6 | 0.08mg | 6% | 61% |
1.6 times less than Oats
|
| Vitamin B12 | 0µg | 0% | 100% |
N/A
|
| Vitamin K | 1.8µg | 2% | 26% |
56.4 times less than Broccoli
|
| Folate | 2µg | 1% | 76% |
30.5 times less than Brussels sprouts
|
| Trans fat | 0g | N/A | 100% |
N/A
|
| Saturated fat | 0.05g | 0% | 83% |
131 times less than Beef broiled
|
| Choline | 7.1mg | 1% | 44% | |
| Monounsaturated fat | 0.08g | N/A | 75% |
119.5 times less than Avocado
|
| Polyunsaturated fat | 0.1g | N/A | 78% |
467.1 times less than Walnut
|
| Fructose | 14g | 18% | 1% |
2.4 times more than Apple
|
| Caffeine | 0mg | 0% | 100% | |
| Omega-3 - EPA | 0g | N/A | 100% |
N/A
|
| Omega-3 - DHA | 0g | N/A | 100% |
N/A
|
| Omega-3 - ALA | 0.02g | N/A | 16% |
435.2 times less than Canola oil
|
| Omega-3 - DPA | 0g | N/A | 100% |
N/A
|
| Omega-3 - Eicosatrienoic acid | 0g | N/A | 100% | |
| Omega-6 - Gamma-linoleic acid | 0g | N/A | 100% | |
| Omega-6 - Dihomo-gamma-linoleic acid | 0g | N/A | 100% | |
| Omega-6 - Eicosadienoic acid | 0g | N/A | 18% | |
| Omega-6 - Linoleic acid | 0.08g | N/A | 20% |
154 times less than Almonds
|
Check out similar food or compare with current
NUTRITION FACTS LABEL
Serving Size ______________
Health checks
Barbecue sauce nutrition infographic
References
All the values for which the sources are not specified explicitly are taken from FDA’s Food Central. The exact link to the food presented on this page can be found below.