Cellophane noodles Nutrition & Calories - Complete data of all nutrients
Introduction
Long, gelatinous noodles made from mung bean starch and water are known as cellophane noodles. They are abundant in China and Southeast Asia. Other names for this food include Chinese vermicelli, fensi, etc. Noodles are quickly cooked and can be served hot, tepid, or cold.
Table of contents
How are Cellophane Noodles Made?
The production process of cellophane noodles is a fascinating blend of tradition and modern technology. The process begins with extracting starch from the chosen source and mixing it with water to form a dough-like consistency. This dough is then extruded through a machine that shapes the noodles into thin, transparent strands. The next crucial step involves steaming the noodles to solidify their structure. Once steamed, the noodles are cooled and typically cut into shorter lengths for packaging.
Nutrition
This article will discuss the nutritional value of Chinese cellophane or long rice noodles (1). Other noodles will be addressed to compare them with cellophane noodles (2).
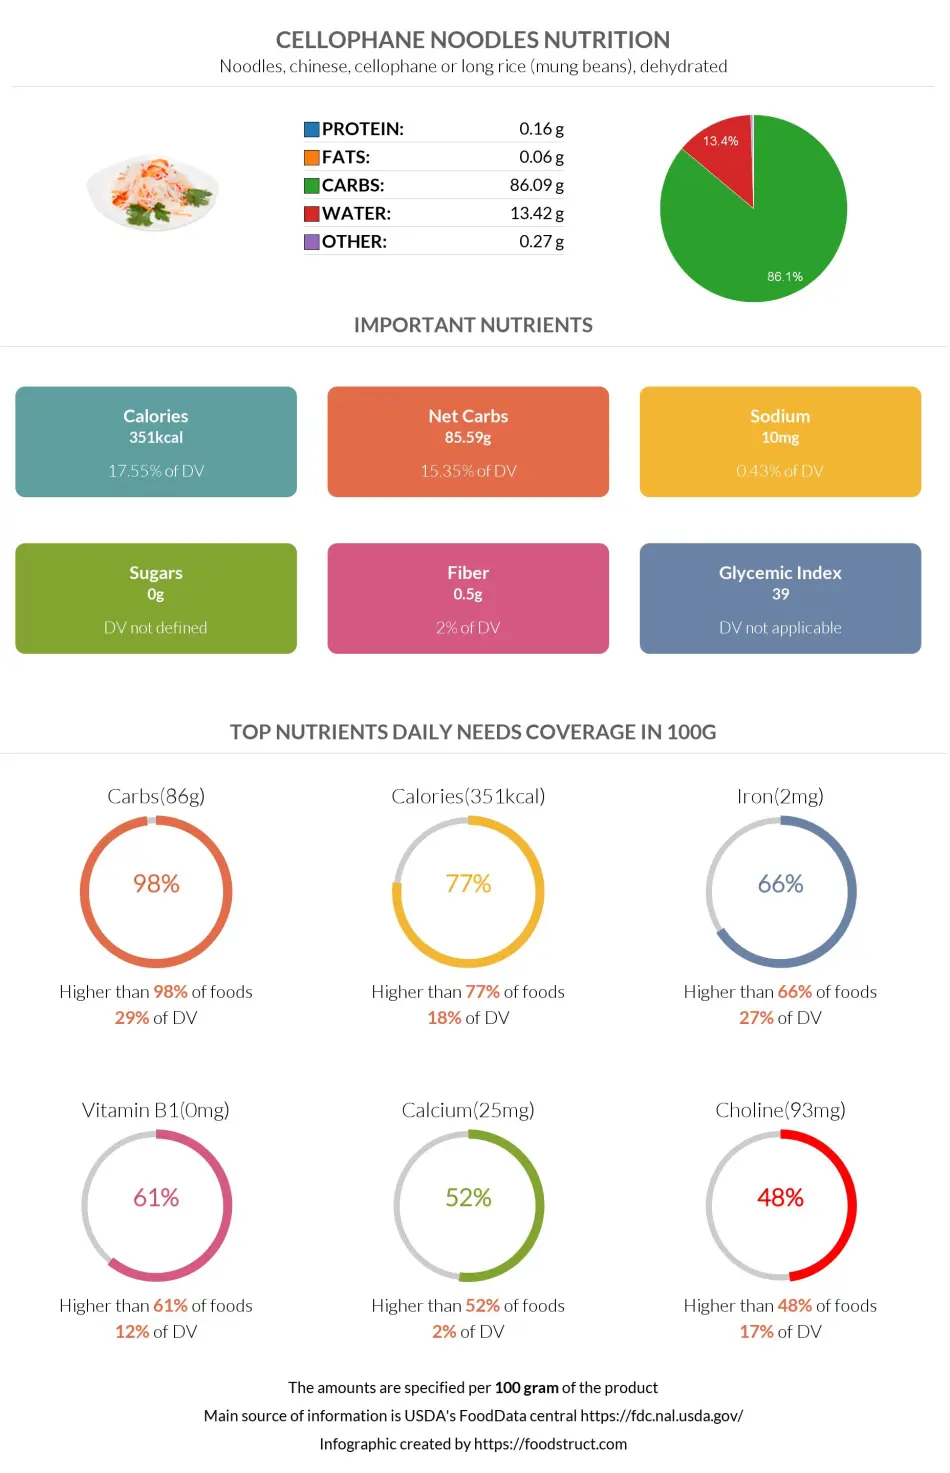
All the nutrition facts are for 100g of cellophane noodles.
Carbs
One hundred grams of cellophane noodles contain 86.1g of carbs. This covers 29% of daily needs. According to our database, cellophane noodles have higher carbs than 98% of foods.
Macronutrients chart
Starch
Cellophane noodles primarily consist of starch, and their nutritional value can be enhanced through gelatinization and retrogradation, primarily by improving starch digestibility. These noodles undergo retrogradation, rendering them a source of resistant starch (6).
Carbs per serving size
A serving size of cellophane noodles (1 cup or 140g) provides 121g of carbs.
Carbohydrate type breakdown
100g of cellophane noodles has 0.5g of fiber. Therefore, these noodles do not contain a significant amount of fiber. There are no sugars in these noodles.
Fiber content ratio for Cellophane noodles
Cellophane noodles net carbs
99% of cellophane noodles’ carbs are net carbs because their fiber amount is minimal. The overall net carb content is 85.6g.
Calories
100g of cellophane noodles contains 351 calories. This means it is an average-calorie food product. Most of these calories come from the 86 grams of carbs it has.
Calories per serving
Cellophane noodles are served in one cup (140 grams). Cellophane noodles contain 491 calories in a serving size.
Calorie comparison
Here, we will compare cellophane noodles with some other types of food.
According to our database, cellophane noodles are higher in calories than 77% of foods.
In the table below, it is indicated that compared to usual noodles, cellophane noodles have almost two times more calories. Cellophane noodles and Vermicelli have approximately similar content of calories.
| Food | Calories per 100 grams |
| Egg noodles | 384 |
| Rice noodles | 364 |
| Cellophane noodles | 351 |
| Vermicelli | 331 |
| Noodle | 138 |
| Beef noodle soup | 34 |
Burning estimates
The table below illustrates the amount of time and type of activity required to burn 491 calories (1 cup of cellophane noodles). Met, or Metabolic Equivalent of a Task, was the method for calculating this (3) (4).
| One cup - 70kg person | 1 cup - 100kg person | |
| Walking | 111 min | 84 min |
| Cycling | 56 min | 40 min |
| Running | 60 min | 42 min |
Vitamins
Cellophane noodles are relatively rich in B-complex vitamins. They contain 0.15mg of vitamin B1 per 100g. This amount is equal to 13% of the daily vitamin B1 needs.
Vitamin B1 plays a crucial role in transmitting neural signals and in muscle constriction. It is also involved in energy synthesis.
Vitamin coverage chart
Minerals
Cellophane noodles do not have that rich mineral profile. They contain a relatively high amount of choline (93.2mg per 100g), phosphorus (32mg per 100g), and calcium (25mg per 100g).
Cellophane noodles are in the top 34% of foods as a source of iron. However, cellophane noodles provide 1.5 times less iron than Beef.
A 100g serving of cellophane noodles covers 27% of the daily iron requirements. You should consider eating this food to take this mineral because it is essential for oxygen transport and energy synthesis (5).
Mineral coverage chart
Protein
Cellophane noodles are not rich in proteins, providing only 0.16g of this nutrient per 100g. A variety of noodles, especially egg noodles, provides more protein than cellophane noodles (14.1g per 100g).
Cellophane noodles are lower in proteins than 94% of the other foods in our database. They are relatively higher in histidine and tryptophan.
Protein quality breakdown
Fats
Cellophane noodles provide an even lower amount of fats than proteins. The fat content is shallow (0.06g per 100g), so it can be neglected.
Fat type information
Glycemic index
Based on carbohydrate levels, cellophane noodles are considered to have a glycemic index of 39. You can check our Glycemic index chart to see the GI values of other foods.
Acidity
Cellophane noodles are acidic. The pH value of cellophane noodles is 0.6.
Gluten-Free
Cellophane noodles are gluten-free and commonly crafted from sweet potato or mung bean starch. It's essential to review labels, as some manufacturers may produce items with gluten. Unlike regular pasta or wheat noodles, glass noodles omit wheat flour, the primary gluten component. The main focus for those on a gluten-free diet is recognizing ingredients and food items devoid of gluten.
Cellophane noodles can be a great gluten-free alternative for those with celiac disease (6).
Different Types of Cellophane Noodles
In one study, cellophane noodles were prepared using two types of beans (navy and pinto) and three varieties of potato starch (Mainechip and commercial potato starch). The potato starches exhibited lower amylose content and higher phosphorus levels than the bean starches. Amylograph pasting properties revealed that potato starches had a lower pasting temperature and peak viscosity but lower shear stability than bean starches (7).
The quality of cornstarch noodles was examined and compared to that of potato starch noodles. The analysis revealed that the cooked weight of noodles made from corn starch was lower than that of those made from potato starch.
References
- https://fdc.nal.usda.gov/fdc-app.html#/food-details/174258/nutrients
- https://fdc.nal.usda.gov/fdc-app.html#/food-details/169731/nutrients
- https://www.ncbi.nlm.nih.gov/pmc/articles/PMC4428382/
- 2011 Compendium of Physical Activities
- https://www.ncbi.nlm.nih.gov/pmc/articles/PMC4331421/
- https://link.springer.com/article/10.1007/s13197-016-2330-9
- https://www.sciencedirect.com/science/article/abs/pii/S0963996909000489

Top nutrition facts for Cellophane noodles
| Calories ⓘ Calories for selected serving | 351 kcal |
|
Glycemic index ⓘ
Source:
The GI for mung bean noodles
Check out our Glycemic index chart page for the full list.
|
39 (low) |
| Glycemic load ⓘ Glycemic Load (GL) is a metric that measures both the quality (Glycemic Index) and quantity of carbohydrates in a specific serving of food to estimate its impact on blood sugar levels. It is calculated as: (GI × Carbs in grams) / 100. | 47 (high) |
| Insulin index ⓘ The insulin index of foods demonstrates how much a food increases the insulin level in the blood, in the first two-hour period after consumption. | 38 ⓘ https://www.ncbi.nlm.nih.gov/pmc/articles/PMC2957607/ – II for mung bean noodles is 38 |
| Net carbs ⓘ Net Carbs = Total Carbohydrates – Fiber – Sugar Alcohols | 86 g |
| Default serving size ⓘ Serving sizes are mostly taken from FDA's Reference Amounts Customarily Consumed (RACCs) | 1 cup (140 g) |
| Acidity (Based on PRAL) ⓘ PRAL (Potential renal acid load) is calculated using a formula. On the PRAL scale the higher the positive value, the more is the acidifying effect on the body. The lower the negative value, the higher the alkalinity of the food. 0 is neutral. | 0.6 (acidic) |
Cellophane noodles calories (kcal)
| Calories for different serving sizes of cellophane noodles | Calories | Weight |
|---|---|---|
| Calories in 100 grams | 351 | |
| Calories in 1 cup | 491 | 140 g |
Extra Nutrition facts for Cellophane noodles
| Weight per 100 calories ⓘ Shows how many grams of this food equal 100 kcal—higher grams mean a larger portion for the same calories. | 28 g |
Cellophane noodles Glycemic index (GI)
Cellophane noodles Glycemic load (GL)
Mineral chart - relative view
Vitamin chart - relative view
All nutrients for Cellophane noodles per 100g
| Nutrient | Value | DV% | In TOP % of foods | Comparison |
| Vitamin A | 0µg | 0% | 100% | |
| Calories | 351kcal | 18% | 24% |
7.5 times more than Orange
|
| Weight per 100 calories | 28g | N/A | 77% | |
| Protein | 0.16g | 0% | 95% |
17.6 times less than Broccoli
|
| Fats | 0.06g | 0% | 95% |
555.2 times less than Cheese
|
| Vitamin C | 0mg | 0% | 100% |
N/A
|
| Net carbs | 86g | N/A | 2% |
1.6 times more than Chocolate
|
| Carbs | 86g | 29% | 2% |
3.1 times more than Rice
|
| Cholesterol | 0mg | 0% | 100% |
N/A
|
| Vitamin D | 0µg | 0% | 100% |
N/A
|
| Vitamin D* | 0 IU | 0% | 100% |
N/A
|
| Magnesium | 3mg | 1% | 86% |
46.7 times less than Almonds
|
| Calcium | 25mg | 3% | 44% |
5 times less than Milk
|
| Potassium | 10mg | 0% | 92% |
14.7 times less than Cucumber
|
| Iron | 2.2mg | 27% | 33% |
1.2 times less than Beef broiled
|
| Sugar | 0g | N/A | 100% |
N/A
|
| Fiber | 0.5g | 2% | 50% |
4.8 times less than Orange
|
| Copper | 0.08mg | 9% | 48% |
1.8 times less than Shiitake
|
| Zinc | 0.41mg | 4% | 66% |
15.4 times less than Beef broiled
|
| Phosphorus | 32mg | 5% | 77% |
5.7 times less than Chicken meat
|
| Sodium | 10mg | 0% | 85% |
49 times less than White bread
|
| Vitamin E | 0.13mg | 1% | 50% |
11.2 times less than Kiwi
|
| Manganese | 0.1mg | 4% | 37% | |
| Selenium | 7.9µg | 14% | 44% | |
| Vitamin B1 | 0.15mg | 13% | 33% |
1.8 times less than Pea raw
|
| Vitamin B2 | 0mg | 0% | 100% |
N/A
|
| Vitamin B3 | 0.2mg | 1% | 81% |
47.9 times less than Turkey meat
|
| Vitamin B5 | 0.1mg | 2% | 64% |
11.3 times less than Sunflower seeds
|
| Vitamin B6 | 0.05mg | 4% | 69% |
2.4 times less than Oats
|
| Vitamin B12 | 0µg | 0% | 100% |
N/A
|
| Vitamin K | 0µg | 0% | 100% |
N/A
|
| Folate | 2µg | 1% | 76% |
30.5 times less than Brussels sprouts
|
| Trans fat | 0g | N/A | 100% |
N/A
|
| Saturated fat | 0.02g | 0% | 88% |
346.8 times less than Beef broiled
|
| Choline | 93mg | 17% | 7% | |
| Monounsaturated fat | 0.01g | N/A | 86% |
1224.9 times less than Avocado
|
| Polyunsaturated fat | 0.02g | N/A | 87% |
2620.8 times less than Walnut
|
| Tryptophan | 0mg | 0% | 57% |
152.5 times less than Chicken meat
|
| Threonine | 0.01mg | 0% | 58% |
144 times less than Beef broiled
|
| Isoleucine | 0.01mg | 0% | 58% |
130.6 times less than Salmon raw
|
| Leucine | 0.01mg | 0% | 57% |
187 times less than Tuna Bluefin
|
| Lysine | 0.01mg | 0% | 58% |
41.1 times less than Tofu
|
| Methionine | 0mg | 0% | 58% |
48 times less than Quinoa
|
| Phenylalanine | 0.01mg | 0% | 57% |
66.8 times less than Egg
|
| Valine | 0.01mg | 0% | 58% |
253.6 times less than Soybean raw
|
| Histidine | 0.01mg | 0% | 57% |
149.8 times less than Turkey meat
|
| Caffeine | 0mg | 0% | 100% | |
| Omega-3 - EPA | 0g | N/A | 100% |
N/A
|
| Omega-3 - DHA | 0g | N/A | 100% |
N/A
|
| Omega-3 - DPA | 0g | N/A | 100% |
N/A
|
Check out similar food or compare with current
NUTRITION FACTS LABEL
Serving Size ______________
Health checks
Cellophane noodles nutrition infographic
References
All the values for which the sources are not specified explicitly are taken from FDA’s Food Central. The exact link to the food presented on this page can be found below.