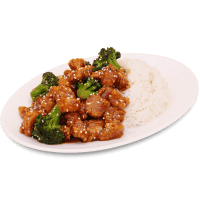
General tso's chicken nutrition: calories, carbs, GI, protein, fiber, fats
Restaurant, Chinese, general tso's chicken
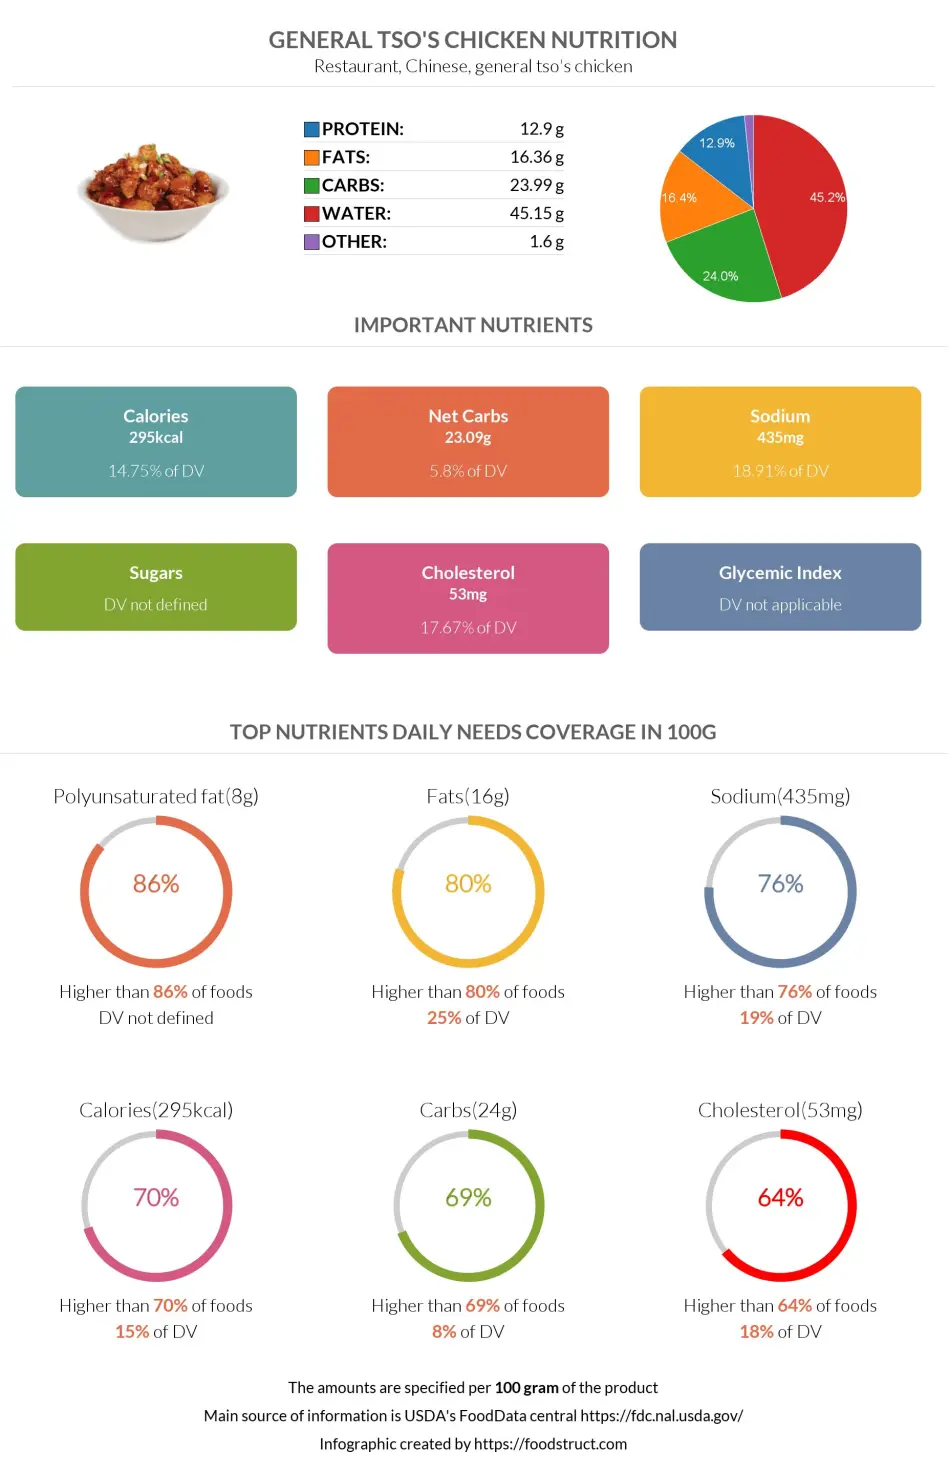
Top nutrition facts for General tso's chicken

| Calories ⓘ Calories for selected serving | 1578 kcal |
| Net Carbs ⓘ Net Carbs = Total Carbohydrates – Fiber – Sugar Alcohols | 124 grams |
| Default serving size ⓘ Serving sizes are mostly taken from FDA's Reference Amounts Customarily Consumed (RACCs) | 1 order (535 grams) |
| Acidity (Based on PRAL) ⓘ PRAL (Potential renal acid load) is calculated using a formula. On the PRAL scale the higher the positive value, the more is the acidifying effect on the body. The lower the negative value, the higher the alkalinity of the food. 0 is neutral. | 6.2 (acidic) |
Polyunsaturated fat ⓘHigher in Polyunsaturated fat content than 86% of foods
Fats ⓘHigher in Fats content than 80% of foods
Sodium ⓘHigher in Sodium content than 76% of foods
Net carbs ⓘHigher in Net carbs content than 71% of foods
Calories ⓘHigher in Calories content than 70% of foods
General tso's chicken calories (kcal)
| Calories for different serving sizes of general tso's chicken | Calories | Weight |
|---|---|---|
| Calories in 100 grams | 295 | |
| Calories in 3 pieces | 156 | 53 g |
| Calories in 1 order | 1578 | 535 g |
Mineral coverage chart
Mineral chart - relative view
Vitamin coverage chart
Vitamin A:
177µg of 900µg
20%
Vitamin E:
19mg of 15mg
129%
Vitamin D:
3.2µg of 20µg
16%
Vitamin C:
26mg of 90mg
29%
Vitamin B1:
0.43mg of 1mg
36%
Vitamin B2:
1.9mg of 1mg
146%
Vitamin B3:
46mg of 16mg
286%
Vitamin B5:
9.9mg of 5mg
198%
Vitamin B6:
3.2mg of 1mg
249%
Folate:
177µg of 400µg
44%
Vitamin B12:
3.5µg of 2µg
147%
Choline:
666mg of 550mg
121%
Vitamin K:
613µg of 120µg
511%
Vitamin chart - relative view
Macronutrients chart
Protein:
Daily Value: 138%
69 g of 50 g
69 g (138% of DV )
Fats:
Daily Value: 135%
87.5 g of 65 g
87.5 g (135% of DV )
Carbs:
Daily Value: 43%
128.3 g of 300 g
128.3 g (43% of DV )
Water:
Daily Value: 12%
241.6 g of 2,000 g
241.6 g (12% of DV )
Other:
8.6 g
8.6 g
Protein quality breakdown
Tryptophan:
2279mg of 280mg
814%
Threonine:
8860mg of 1,050mg
844%
Isoleucine:
9052mg of 1,400mg
647%
Leucine:
16467mg of 2,730mg
603%
Lysine:
17478mg of 2,100mg
832%
Methionine:
5329mg of 1,050mg
507%
Phenylalanine:
9036mg of 1,750mg
516%
Valine:
9742mg of 1,820mg
535%
Histidine:
5345mg of 700mg
764%
Fat type information
Saturated fat:
15 g
Monounsaturated fat:
21 g
Polyunsaturated fat:
40 g
Carbohydrate type breakdown
Starch:
63 g
Sucrose:
56 g
Glucose:
3.3 g
Fructose:
2.7 g
Lactose:
0 g
Maltose:
0 g
Galactose:
0 g
Fiber content ratio for General tso's chicken
Sugar:
62 g
Fiber:
4.8 g
Other:
61 g
All nutrients for General tso's chicken per selected serving size (1 order - 535g)
| Nutrient | Value | DV% | In TOP % of foods | Comparison |
| Vitamin A | 59µg | 7% | 50% | |
| Calories | 1578kcal | 79% | 30% |
6.3 times more than Orange
|
| Protein | 69g | 164% | 37% |
4.6 times more than Broccoli
|
| Fats | 88g | 135% | 20% |
2 times less than Cheese
|
| Vitamin C | 8.6mg | 10% | 38% |
33.1 times less than Lemon
|
| Net carbs | 124g | N/A | 29% |
2.3 times less than Chocolate
|
| Carbs | 128g | 43% | 31% |
1.2 times less than Rice
|
| Cholesterol | 284mg | 95% | 36% |
7 times less than Egg
|
| Vitamin D | 1.1µg | 11% | 53% |
11 times less than Egg
|
| Magnesium | 96mg | 23% | 66% |
7.8 times less than Almonds
|
| Calcium | 64mg | 6% | 71% |
10.4 times less than Milk
|
| Potassium | 1075mg | 32% | 59% |
1.4 times more than Cucumber
|
| Iron | 6.2mg | 78% | 55% |
2.2 times less than Beef broiled
|
| Sugar | 62g | N/A | 37% |
1.3 times more than Coca-Cola
|
| Fiber | 4.8g | 19% | 51% |
2.7 times less than Orange
|
| Copper | 0.25mg | 27% | 82% |
3.1 times less than Shiitake
|
| Zinc | 7mg | 63% | 48% |
4.9 times less than Beef broiled
|
| Starch | 63g | 26% | 93% |
1.3 times less than Potato
|
| Phosphorus | 679mg | 97% | 57% |
1.4 times less than Chicken meat
|
| Sodium | 2327mg | 101% | 24% |
1.1 times less than White bread
|
| Vitamin E | 6.5mg | 43% | 44% |
1.2 times less than Kiwi
|
| Manganese | 0.4mg | 17% | 63% | |
| Selenium | 77µg | 140% | 54% | |
| Vitamin B1 | 0.14mg | 12% | 84% |
9.9 times less than Pea raw
|
| Vitamin B2 | 0.63mg | 49% | 64% |
1.1 times less than Avocado
|
| Vitamin B3 | 15mg | 95% | 52% |
3.4 times less than Turkey meat
|
| Vitamin B5 | 3.3mg | 66% | 51% |
1.8 times less than Sunflower seeds
|
| Vitamin B6 | 1.1mg | 83% | 48% |
1.7 times more than Oats
|
| Vitamin B12 | 1.2µg | 49% | 58% |
3.2 times less than Pork
|
| Vitamin K | 204µg | 170% | 45% |
2.7 times less than Broccoli
|
| Trans fat | 0.48g | N/A | 63% |
165.4 times less than Margarine
|
| Folate | 59µg | 15% | 59% |
5.5 times less than Brussels sprouts
|
| Choline | 222mg | 40% | 67% | |
| Saturated fat | 15g | 74% | 40% |
2.1 times less than Beef broiled
|
| Monounsaturated fat | 21g | N/A | 38% |
2.5 times less than Avocado
|
| Polyunsaturated fat | 40g | N/A | 14% |
6.3 times less than Walnut
|
| Tryptophan | 0.76mg | 0% | 73% |
2.1 times less than Chicken meat
|
| Threonine | 3mg | 0% | 72% |
1.3 times less than Beef broiled
|
| Isoleucine | 3mg | 0% | 72% |
1.6 times less than Salmon raw
|
| Leucine | 5.5mg | 0% | 73% |
2.4 times less than Tuna Bluefin
|
| Lysine | 5.8mg | 0% | 70% |
2.4 times more than Tofu
|
| Methionine | 1.8mg | 0% | 71% |
3.5 times more than Quinoa
|
| Phenylalanine | 3mg | 0% | 73% |
1.2 times less than Egg
|
| Valine | 3.2mg | 0% | 74% |
3.3 times less than Soybean raw
|
| Histidine | 1.8mg | 0% | 73% |
2.2 times less than Turkey meat
|
| Fructose | 2.7g | 3% | 88% |
11.6 times less than Apple
|
| Caffeine | 0mg | 0% | 100% | |
| Omega-3 - EPA | 0.03g | N/A | 42% |
138 times less than Salmon
|
| Omega-3 - DHA | 0.03g | N/A | 43% |
292 times less than Salmon
|
| Omega-3 - ALA | 4.5g | N/A | 79% |
10.9 times less than Canola oil
|
| Omega-3 - DPA | 0.03g | N/A | 48% |
28.3 times less than Salmon
|
| Omega-3 - Eicosatrienoic acid | 0.01g | N/A | 93% | |
| Omega-6 - Gamma-linoleic acid | 0.03g | N/A | 87% | |
| Omega-6 - Dihomo-gamma-linoleic acid | 0.05g | N/A | 92% | |
| Omega-6 - Eicosadienoic acid | 0.06g | N/A | 78% | |
| Omega-6 - Linoleic acid | 35g | N/A | 81% |
1.9 times less than Almonds
|
Check out similar food or compare with current
NUTRITION FACTS LABEL
Nutrition Facts
___servings per container
Serving Size ______________
Serving Size ______________
Amount Per 100g
Calories 1578
% Daily Value*
135%
Total Fat
88g
67%
Saturated Fat 15g
0
Trans Fat
0g
95%
Cholesterol 284mg
101%
Sodium 2327mg
43%
Total Carbohydrate
128g
19%
Dietary Fiber
4.8g
Total Sugars 0g
Includes ? g Added Sugars
Protein
69g
Vitamin D
32mcg
4%
Calcium
64mg
6.4%
Iron
6.2mg
78%
Potassium
1075mg
32%
*
The % Daily Value (DV) tells you how much a nutrient in a serving of food contributes to a daily diet. 2,000 calories a day is used for general nutrition advice.
Health checks
ⓘ
Dietary cholesterol is not associated with an increased risk of coronary heart disease in healthy individuals. However, dietary cholesterol is common in foods that are high in harmful saturated fats.
Source
Low in Cholesterol
ⓘ
Trans fat consumption increases the risk of cardiovascular disease and mortality by negatively affecting blood lipid levels.
Source
No Trans Fats
ⓘ
Saturated fat intake can raise total cholesterol and LDL (low-density lipoprotein) levels, leading to an increased risk of atherosclerosis. Dietary guidelines recommend limiting saturated fats to under 10% of calories a day.
Source
Low in Saturated Fats
ⓘ
While the consumption of moderate amounts of added sugars is not detrimental to health, an excessive intake can increase the risk of obesity, and therefore, diabetes.
Source
Low in Sugars
General tso's chicken nutrition infographic
Infographic link
References
All the values for which the sources are not specified explicitly are taken from FDA’s Food Central. The exact link to the food presented on this page can be found below.