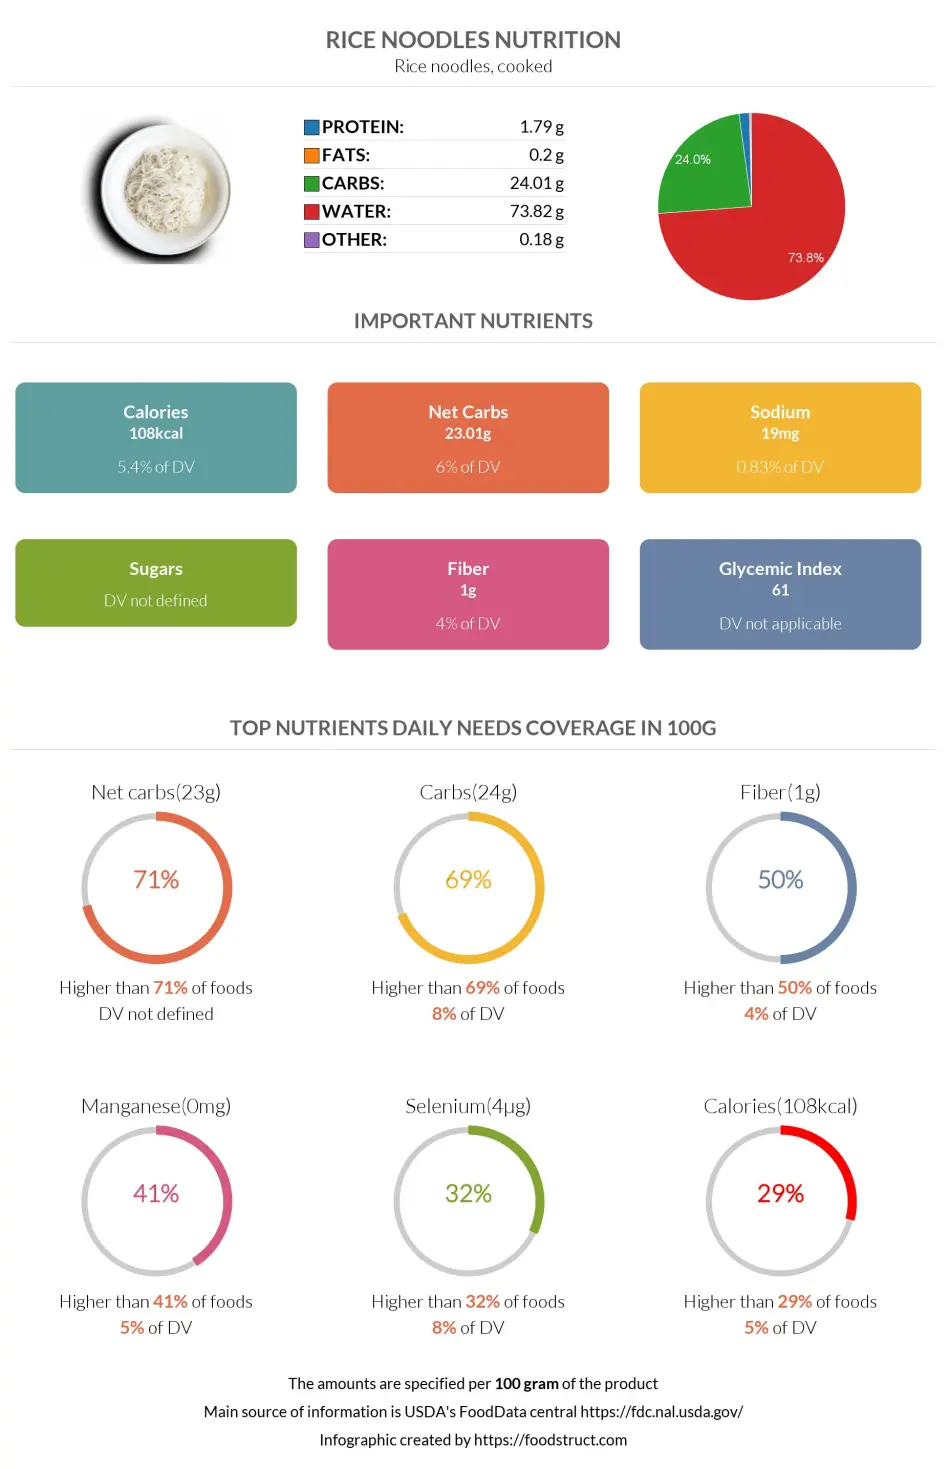
Rice noodles nutrition: calories, carbs, GI, protein, fiber, fats
Rice noodles, cooked
*all the values are displayed for the amount of 100 grams
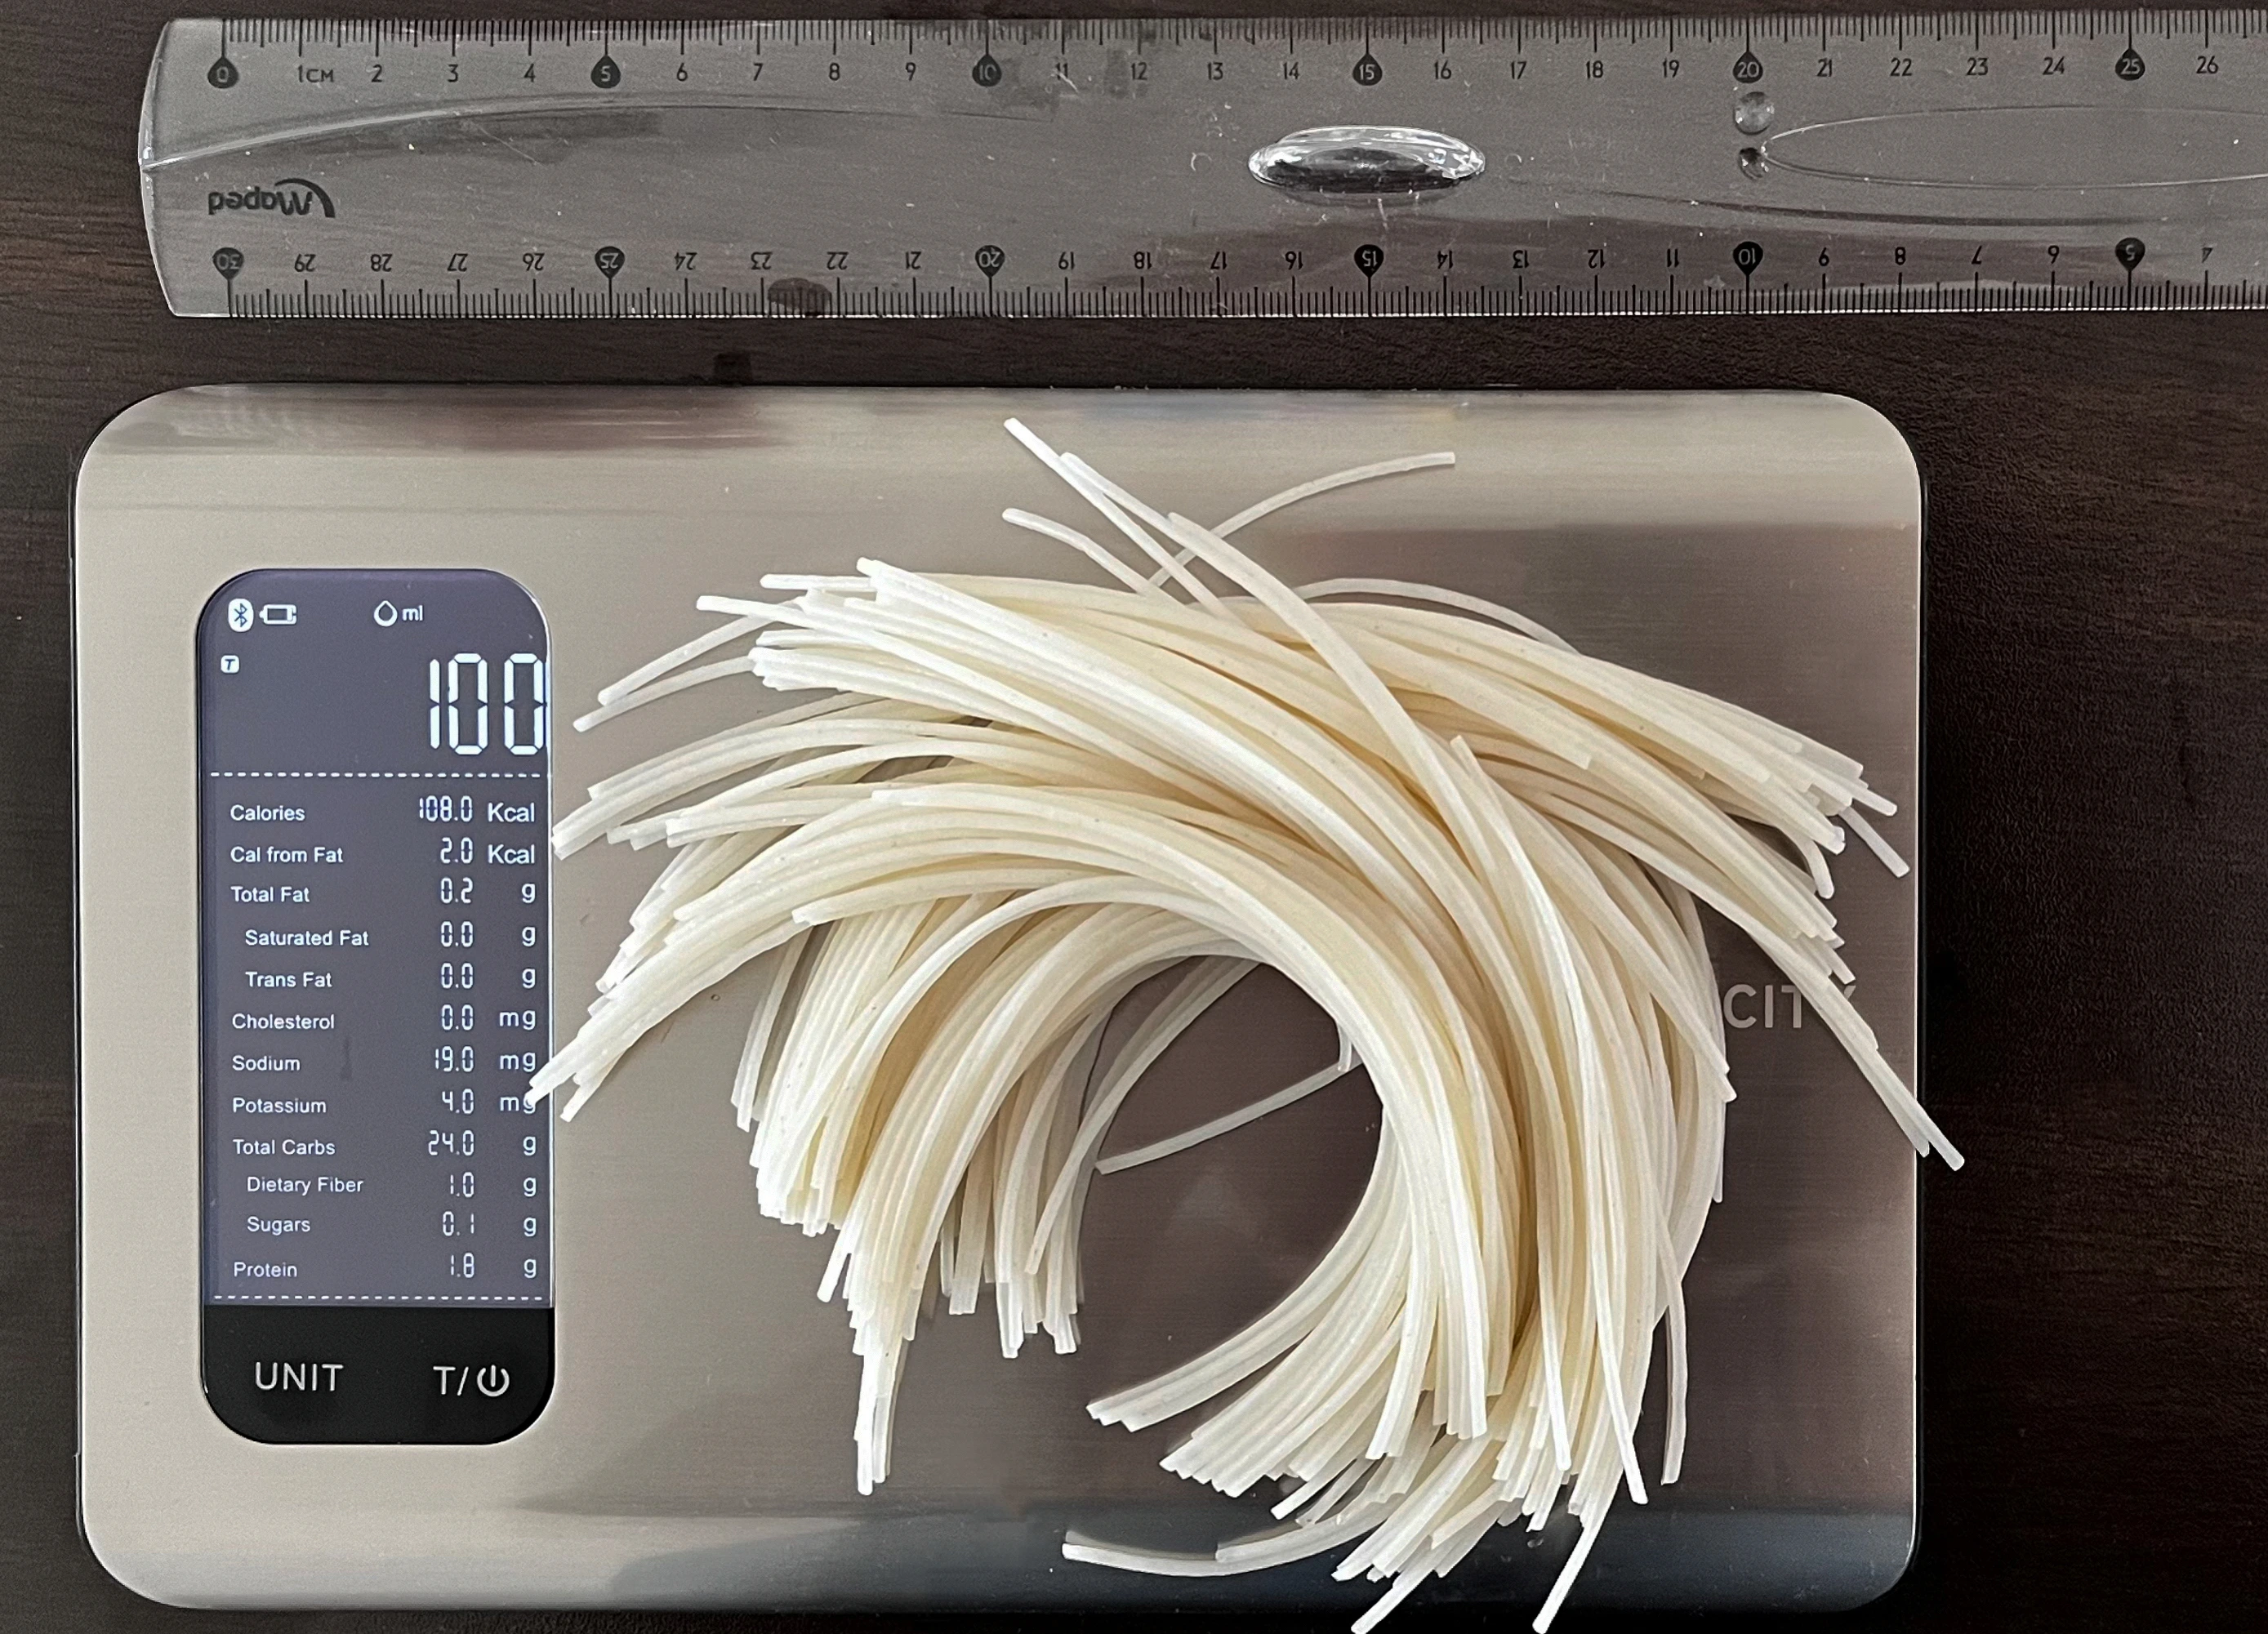
What Do 108 Calories or 100 Grams of Rice Noodles Look Like?
Our team measured what 100 grams or 108 calories of rice noodles look like to help you visualize its weight and calories. It's important to note that the actual calorie and gram count can fluctuate depending on the thickness and length of the noodles.
Top nutrition facts for Rice noodles
| Calories ⓘ Calories for selected serving | 108 kcal |
|
Glycemic index ⓘ
Source: The GI for rice noodles, dried then boiled. https://www.sciencedirect.com/science/article/pii/S0002916522004944
Check out our Glycemic index chart page for the full list.
|
61 (medium) |
| Glycemic load ⓘ Glycemic Load (GL) is a metric that measures both the quality (Glycemic Index) and quantity of carbohydrates in a specific serving of food to estimate its impact on blood sugar levels. It is calculated as: (GI × Carbs in grams) / 100. | 25 (high) |
| Net carbs ⓘ Net Carbs = Total Carbohydrates – Fiber – Sugar Alcohols | 23 g |
| Default serving size ⓘ Serving sizes are mostly taken from FDA's Reference Amounts Customarily Consumed (RACCs) | 1 cup (176 g) |
| Acidity (Based on PRAL) ⓘ PRAL (Potential renal acid load) is calculated using a formula. On the PRAL scale the higher the positive value, the more is the acidifying effect on the body. The lower the negative value, the higher the alkalinity of the food. 0 is neutral. | 1.4 (acidic) |
Rice noodles calories (kcal)
| Calories for different serving sizes of rice noodles | Calories | Weight |
|---|---|---|
| Calories in 100 grams | 108 | |
| Calories in 1 cup | 190 | 176 g |
| Calories for different varieties of rice noodles | Calories | Weight |
|---|---|---|
| Rice noodles, cooked (this food) | 108 | 100 g |
| Rice mix, white and wild, flavored, unprepared | 355 | 100 g |
| Rice mix, cheese flavor, dry mix, unprepared | 362 | 100 g |
| Rice flour, brown | 363 | 100 g |
| Rice noodles | 364 | 100 g |
| Rice flour, white, unenriched | 366 | 100 g |
Extra Nutrition facts for Rice noodles
| Protein per 100 calories ⓘ Shows how many grams of protein you get from 100 calories of this food, calculated as (protein in g ÷ calories) × 100. | 1.7 g |
| Calories per 10 g protein ⓘ Shows how many calories you need to eat from this food to get 10 g of protein, calculated as (calories ÷ protein in g) × 10. | 603 kcal |
| Weight per 100 calories ⓘ Shows how many grams of this food equal 100 kcal—higher grams mean a larger portion for the same calories. | 93 g |
Rice noodles Glycemic index (GI)
Source:
The GI for rice noodles, dried then boiled. https://www.sciencedirect.com/science/article/pii/S0002916522004944
Check out our Glycemic index chart page for the full list.
Rice noodles Glycemic load (GL)
Mineral coverage chart
Mineral chart - relative view
Vitamin coverage chart
Vitamin A:
0µg of 900µg
0%
Vitamin E:
0.09mg of 15mg
0.6%
Vitamin D:
0µg of 20µg
0%
Vitamin C:
0mg of 90mg
0%
Vitamin B1:
0.05mg of 1mg
4.5%
Vitamin B2:
0.01mg of 1mg
0.92%
Vitamin B3:
0.22mg of 16mg
1.4%
Vitamin B5:
0.03mg of 5mg
0.66%
Vitamin B6:
0.02mg of 1mg
1.4%
Folate:
3µg of 400µg
0.75%
Vitamin B12:
0µg of 2µg
0%
Vitamin K:
0µg of 120µg
0%
Vitamin chart - relative view
Macronutrients chart
Protein:
Daily Value: 4%
1.8 g of 50 g
1.8 g (4% of DV )
Fats:
Daily Value: 0%
0.2 g of 65 g
0.2 g (0% of DV )
Carbs:
Daily Value: 8%
24 g of 300 g
24 g (8% of DV )
Water:
Daily Value: 4%
73.8 g of 2,000 g
73.8 g (4% of DV )
Other:
0.2 g
0.2 g
Protein quality breakdown
Tryptophan:
66mg of 280mg
24%
Threonine:
189mg of 1,050mg
18%
Isoleucine:
219mg of 1,400mg
16%
Leucine:
441mg of 2,730mg
16%
Lysine:
186mg of 2,100mg
8.9%
Methionine:
129mg of 1,050mg
12%
Phenylalanine:
285mg of 1,750mg
16%
Valine:
312mg of 1,820mg
17%
Histidine:
135mg of 700mg
19%
Fat type information
Saturated fat:
0.02 g
Monounsaturated fat:
0.03 g
Polyunsaturated fat:
0.02 g
Fiber content ratio for Rice noodles
Sugar:
0.03 g
Fiber:
1 g
Other:
23 g
All nutrients for Rice noodles per 100g
| Nutrient | Value | DV% | In TOP % of foods | Comparison |
| Vitamin A | 0µg | 0% | 100% | |
| Calories | 108kcal | 5% | 72% |
2.3 times more than Orange
|
| Protein per 100 calories | 1.7g | N/A | 77% | |
| Calories per 10 g protein | 603kcal | N/A | 20% | |
| Weight per 100 calories | 93g | N/A | 29% | |
| Protein | 1.8g | 4% | 80% |
1.6 times less than Broccoli
|
| Fats | 0.2g | 0% | 89% |
166.6 times less than Cheese
|
| Vitamin C | 0mg | 0% | 100% |
N/A
|
| Carbs | 24g | 8% | 31% |
1.2 times less than Rice
|
| Net carbs | 23g | N/A | 30% |
2.4 times less than Chocolate
|
| Cholesterol | 0mg | 0% | 100% |
N/A
|
| Vitamin D* | 0 IU | 0% | 100% |
N/A
|
| Vitamin D | 0µg | 0% | 100% |
N/A
|
| Magnesium | 3mg | 1% | 86% |
46.7 times less than Almonds
|
| Calcium | 4mg | 0% | 90% |
31.3 times less than Milk
|
| Potassium | 4mg | 0% | 93% |
36.8 times less than Cucumber
|
| Iron | 0.14mg | 2% | 90% |
18.6 times less than Beef broiled
|
| Sugar | 0.03g | N/A | 55% |
299 times less than Coca-Cola
|
| Fiber | 1g | 4% | 44% |
2.4 times less than Orange
|
| Copper | 0.04mg | 4% | 72% |
3.7 times less than Shiitake
|
| Zinc | 0.25mg | 2% | 74% |
25.2 times less than Beef broiled
|
| Phosphorus | 20mg | 3% | 82% |
9.1 times less than Chicken meat
|
| Sodium | 19mg | 1% | 81% |
25.8 times less than White bread
|
| Vitamin E | 0.03mg | 0% | 60% |
48.7 times less than Kiwi
|
| Manganese | 0.11mg | 5% | 35% | |
| Selenium | 4.5µg | 8% | 50% | |
| Vitamin B1 | 0.02mg | 2% | 82% |
14.8 times less than Pea raw
|
| Vitamin B2 | 0mg | 0% | 89% |
32.5 times less than Avocado
|
| Vitamin B3 | 0.07mg | 0% | 87% |
133 times less than Turkey meat
|
| Vitamin B5 | 0.01mg | 0% | 71% |
102.7 times less than Sunflower seeds
|
| Vitamin B6 | 0.01mg | 0% | 85% |
19.8 times less than Oats
|
| Vitamin B12 | 0µg | 0% | 100% |
N/A
|
| Vitamin K | 0µg | 0% | 100% |
N/A
|
| Folate | 1µg | 0% | 79% |
61 times less than Brussels sprouts
|
| Saturated fat | 0.02g | 0% | 87% |
256.3 times less than Beef broiled
|
| Choline | 1.6mg | 0% | 51% | |
| Monounsaturated fat | 0.03g | N/A | 81% |
376.9 times less than Avocado
|
| Polyunsaturated fat | 0.02g | N/A | 87% |
2051 times less than Walnut
|
| Tryptophan | 0.02mg | 0% | 50% |
13.9 times less than Chicken meat
|
| Threonine | 0.06mg | 0% | 52% |
11.4 times less than Beef broiled
|
| Isoleucine | 0.07mg | 0% | 51% |
12.5 times less than Salmon raw
|
| Leucine | 0.15mg | 0% | 50% |
16.5 times less than Tuna Bluefin
|
| Lysine | 0.06mg | 0% | 53% |
7.3 times less than Tofu
|
| Methionine | 0.04mg | 0% | 49% |
2.2 times less than Quinoa
|
| Phenylalanine | 0.1mg | 0% | 50% |
7 times less than Egg
|
| Valine | 0.1mg | 0% | 51% |
19.5 times less than Soybean raw
|
| Histidine | 0.05mg | 0% | 50% |
16.6 times less than Turkey meat
|
| Caffeine | 0mg | 0% | 100% | |
| Omega-3 - EPA | 0g | N/A | 100% |
N/A
|
| Omega-3 - DHA | 0g | N/A | 100% |
N/A
|
| Omega-3 - DPA | 0g | N/A | 100% |
N/A
|
Check out similar food or compare with current
NUTRITION FACTS LABEL
Nutrition Facts
___servings per container
Serving Size ______________
Serving Size ______________
Amount Per 100g
Calories 108
% Daily Value*
0.31%
Total Fat
0.2g
0.1%
Saturated Fat 0.02g
0
Trans Fat
0g
0
Cholesterol 0mg
0.83%
Sodium 19mg
8%
Total Carbohydrate
24g
4%
Dietary Fiber
1g
Total Sugars 0g
Includes ? g Added Sugars
Protein
1.8g
Vitamin D
0mcg
0
Calcium
4mg
0.4%
Iron
0.14mg
1.8%
Potassium
4mg
0.12%
*
The % Daily Value (DV) tells you how much a nutrient in a serving of food contributes to a daily diet. 2,000 calories a day is used for general nutrition advice.
Health checks
ⓘ
Dietary cholesterol is not associated with an increased risk of coronary heart disease in healthy individuals. However, dietary cholesterol is common in foods that are high in harmful saturated fats.
Source
Low in Cholesterol
ⓘ
Trans fat consumption increases the risk of cardiovascular disease and mortality by negatively affecting blood lipid levels.
Source
No Trans Fats
ⓘ
Saturated fat intake can raise total cholesterol and LDL (low-density lipoprotein) levels, leading to an increased risk of atherosclerosis. Dietary guidelines recommend limiting saturated fats to under 10% of calories a day.
Source
Low in Saturated Fats
ⓘ
While the consumption of moderate amounts of added sugars is not detrimental to health, an excessive intake can increase the risk of obesity, and therefore, diabetes.
Source
Low in Sugars
Rice noodles nutrition infographic
Infographic link
References
All the values for which the sources are not specified explicitly are taken from FDA’s Food Central. The exact link to the food presented on this page can be found below.