A recap on the differences between burbot and mussels Burbot has more vitamin B6; however, mussels is higher in vitamin B12, manganese, selenium, iron, vitamin B2, folate, vitamin B5, zinc, and vitamin C. Mussels covers your daily vitamin B12 needs 962% more than burbot. Mussels contains 3 times less vitamin B6 than burbot. Burbot contains 0.346mg of vitamin B6, while mussels contains 0.1mg. The glycemic index of mussels is higher. Food varieties used in this article are Fish, burbot, cooked, dry heat and Mollusks, mussel, blue, cooked, moist heat .
Infographic
Mineral Comparison
Mineral comparison score is based on the number of minerals by which one or the other food is richer. The "coverage" charts below show how much of the daily needs can be covered by 300 grams of the food.
4
100 g
300 g
3 oz - 85g 1 fillet - 90g
Magnesium
Magnesium
Calcium
Calcium
Potassium
Potassium
Iron
Iron
Copper
Copper
Zinc
Zinc
Phosphorus
Phosphorus
Sodium
Sodium
Manganese
Manganese
Selenium
Selenium
29%
19%
46%
43%
85%
26%
110%
16%
117%
88%
5
100 g
300 g
3 oz - 85g
Magnesium
Magnesium
Calcium
Calcium
Potassium
Potassium
Iron
Iron
Copper
Copper
Zinc
Zinc
Phosphorus
Phosphorus
Sodium
Sodium
Manganese
Manganese
Selenium
Selenium
26%
9.9%
24%
252%
50%
73%
122%
48%
887%
489%
Vitamin Comparison
Vitamin comparison score is based on the number of vitamins by which one or the other food is richer. The "coverage" charts below show how much of the daily needs can be covered by 300 grams of the food.
2
100 g
300 g
3 oz - 85g 1 fillet - 90g
Vitamin C
Vit. C
Vitamin D
Vit. D
Vitamin A
Vit. A
Vitamin E
Vit. E
Vitamin B1
Vit. B1
Vitamin B2
Vit. B2
Vitamin B3
Vit. B3
Vitamin B5
Vit. B5
Vitamin B6
Vit. B6
Vitamin B12
Vit. B12
Vitamin K
Vit. K
Folate
Folate
0%
0%
1.7%
0%
107%
40%
37%
10%
80%
115%
0%
0.75%
7
100 g
300 g
3 oz - 85g
Vitamin C
Vit. C
Vitamin D
Vit. D
Vitamin A
Vit. A
Vitamin E
Vit. E
Vitamin B1
Vit. B1
Vitamin B2
Vit. B2
Vitamin B3
Vit. B3
Vitamin B5
Vit. B5
Vitamin B6
Vit. B6
Vitamin B12
Vit. B12
Vitamin K
Vit. K
Folate
Folate
45%
0%
30%
0%
75%
97%
56%
57%
23%
3000%
0%
57%
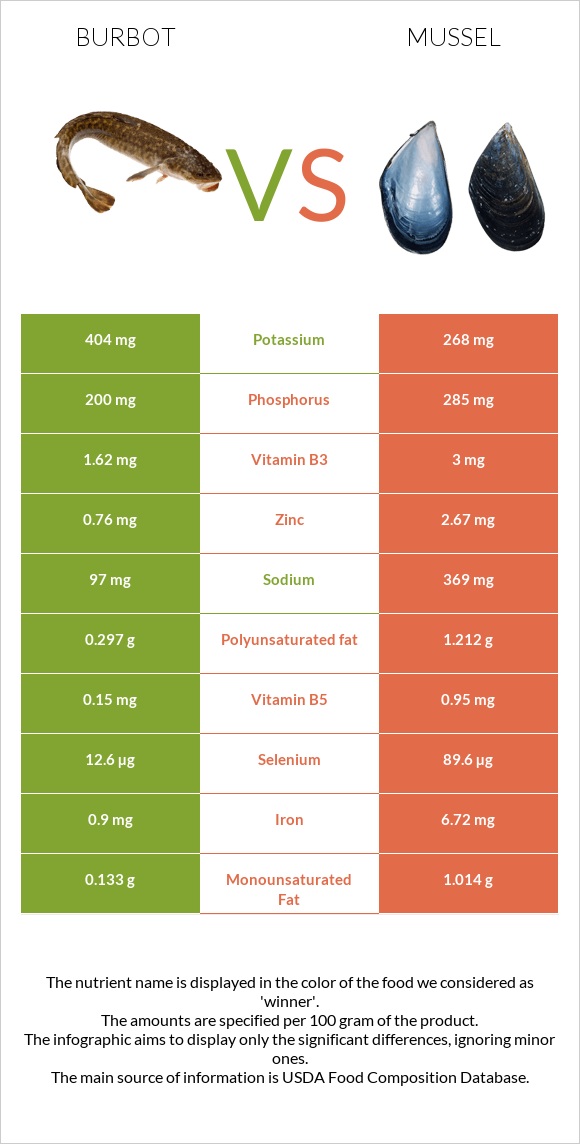
All nutrients comparison - raw data values
Nutrient
DV% diff.
Vitamin B12
0.92µg
24µg
962%
Manganese
0.897mg
6.8mg
257%
Selenium
16.2µg
89.6µg
133%
Iron
1.15mg
6.72mg
70%
Vitamin B2
0.172mg
0.42mg
19%
Vitamin B6
0.346mg
0.1mg
19%
Folate
1µg
76µg
19%
Vitamin B5
0.173mg
0.95mg
16%
Vitamin C
0mg
13.6mg
15%
Zinc
0.97mg
2.67mg
15%
Copper
0.256mg
0.149mg
12%
Sodium
124mg
369mg
11%
Vitamin B1
0.429mg
0.3mg
11%
Vitamin A
5µg
91µg
10%
Cholesterol
77mg
56mg
7%
Potassium
518mg
268mg
7%
Vitamin B3
1.973mg
3mg
6%
Polyunsaturated fat
0.381g
1.212g
6%
Fats
1.04g
4.48g
5%
Phosphorus
256mg
285mg
4%
Calories
115kcal
172kcal
3%
Calcium
64mg
33mg
3%
Saturated fat
0.209g
0.85g
3%
Protein
24.76g
23.8g
2%
Carbs
0g
7.39g
2%
Monounsaturated fat
0.17g
1.014g
2%
Magnesium
41mg
37mg
1%
Protein per 100 calories
22g
14g
N/A
Calories per 10 g protein
46kcal
72kcal
N/A
Weight per 100 calories
87g
58g
N/A
Unsaturated / Saturated Fat ratio
2.6
2.6
N/A
Net carbs
0g
7.39g
N/A
Tryptophan
0.277mg
0.267mg
0%
Threonine
1.085mg
1.025mg
0%
Isoleucine
1.141mg
1.036mg
0%
Leucine
2.012mg
1.676mg
0%
Lysine
2.274mg
1.779mg
0%
Methionine
0.733mg
0.537mg
0%
Phenylalanine
0.966mg
0.853mg
0%
Valine
1.275mg
1.04mg
0%
Histidine
0.729mg
0.457mg
0%
Omega-3 - EPA
0.09g
0.276g
N/A
Omega-3 - DHA
0.123g
0.506g
N/A
Omega-3 - DPA
0.033g
0.044g
N/A
Macronutrient Comparison
Macronutrient breakdown side-by-side comparison
2
25%
73%
Protein:
24.76 g
Fats:
1.04 g
Carbs:
0 g
Water:
73.41 g
Other:
0.79 g
3
24%
4%
7%
61%
3%
Protein:
23.8 g
Fats:
4.48 g
Carbs:
7.39 g
Water:
61.15 g
Other:
3.18 g
Contains
more
Water Water
+20%
Contains
more
Fats Fats
+330.8%
Contains
more
Carbs Carbs
+∞%
Contains
more
Other Other
+302.5%
Fat Type Comparison
Fat type breakdown side-by-side comparison
1
28%
22%
50%
Saturated fat:
Sat. Fat
0.209 g
Monounsaturated fat:
Mono. Fat
0.17 g
Polyunsaturated fat:
Poly. Fat
0.381 g
2
28%
33%
39%
Saturated fat:
Sat. Fat
0.85 g
Monounsaturated fat:
Mono. Fat
1.014 g
Polyunsaturated fat:
Poly. Fat
1.212 g
Contains
less
Sat. Fat Saturated fat
-75.4%
Contains
more
Mono. Fat Monounsaturated fat
+496.5%
Contains
more
Poly. Fat Polyunsaturated fat
+218.1%