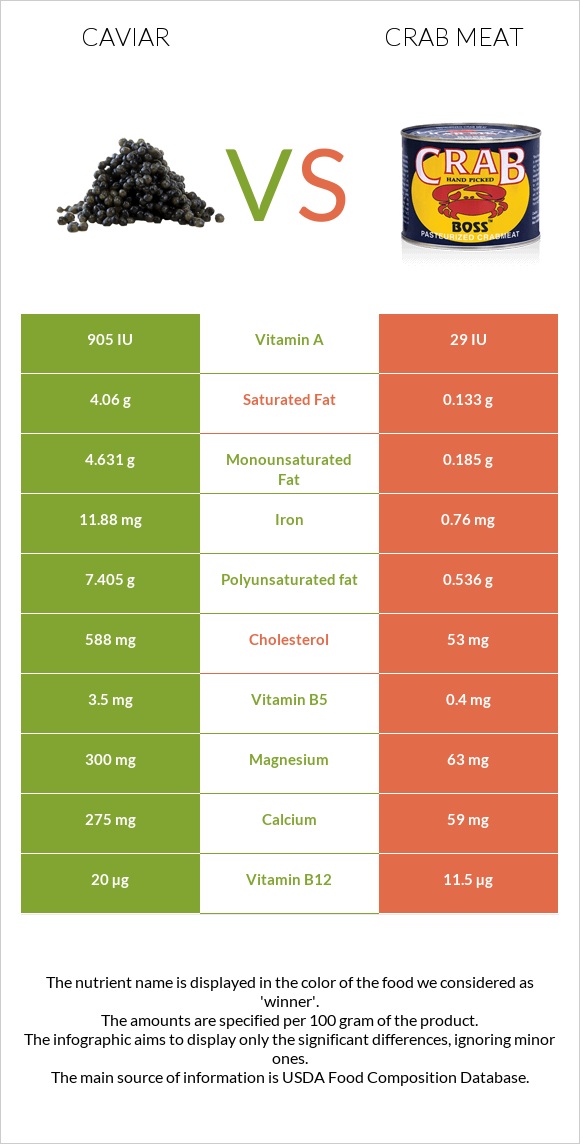
How are caviar and crab meat different? Caviar is higher in vitamin B12, iron, vitamin B5, magnesium, selenium, vitamin B2, and calcium; however, crab meat is richer in copper and zinc. Daily need coverage for vitamin B12 for caviar is 354% higher. Caviar contains 16 times more iron than crab meat. While caviar contains 11.88mg of iron, crab meat contains only 0.76mg. Crab meat has less cholesterol. Fish, caviar, black, and red, granular and Crustaceans, crab, alaska king, cooked, moist heat are the varieties used in this article.
Infographic
Mineral Comparison
Mineral comparison score is based on the number of minerals by which one or the other food is richer. The "coverage" charts below show how much of the daily needs can be covered by 300 grams of the food.
6
100 g
300 g
1 tbsp - 16g 1 oz - 28.35g
Magnesium
Magnesium
Calcium
Calcium
Potassium
Potassium
Iron
Iron
Copper
Copper
Zinc
Zinc
Phosphorus
Phosphorus
Sodium
Sodium
Manganese
Manganese
Selenium
Selenium
214%
83%
16%
446%
37%
26%
153%
196%
6.5%
357%
4
100 g
300 g
3 oz - 85g 1 leg - 134g
Magnesium
Magnesium
Calcium
Calcium
Potassium
Potassium
Iron
Iron
Copper
Copper
Zinc
Zinc
Phosphorus
Phosphorus
Sodium
Sodium
Manganese
Manganese
Selenium
Selenium
45%
18%
23%
29%
394%
208%
120%
140%
5.2%
218%
Vitamin Comparison
Vitamin comparison score is based on the number of vitamins by which one or the other food is richer. The "coverage" charts below show how much of the daily needs can be covered by 300 grams of the food.
9
100 g
300 g
1 tbsp - 16g 1 oz - 28.35g
Vitamin C
Vit. C
Vitamin D
Vit. D
Vitamin A
Vit. A
Vitamin E
Vit. E
Vitamin B1
Vit. B1
Vitamin B2
Vit. B2
Vitamin B3
Vit. B3
Vitamin B5
Vit. B5
Vitamin B6
Vit. B6
Vitamin B12
Vit. B12
Vitamin K
Vit. K
Folate
Folate
0%
44%
90%
38%
48%
143%
2.3%
210%
74%
2500%
1.5%
38%
2
100 g
300 g
3 oz - 85g 1 leg - 134g
Vitamin C
Vit. C
Vitamin D
Vit. D
Vitamin A
Vit. A
Vitamin E
Vit. E
Vitamin B1
Vit. B1
Vitamin B2
Vit. B2
Vitamin B3
Vit. B3
Vitamin B5
Vit. B5
Vitamin B6
Vit. B6
Vitamin B12
Vit. B12
Vitamin K
Vit. K
Folate
Folate
25%
0%
3%
0%
13%
13%
25%
24%
42%
1438%
0%
38%
All nutrients comparison - raw data values
Nutrient
DV% diff.
Vitamin B12
20µg
11.5µg
354%
Cholesterol
588mg
53mg
178%
Iron
11.88mg
0.76mg
139%
Copper
0.11mg
1.182mg
119%
Choline
490.9mg
89%
Vitamin B5
3.5mg
0.4mg
62%
Zinc
0.95mg
7.62mg
61%
Magnesium
300mg
63mg
56%
Selenium
65.5µg
40µg
46%
Polyunsaturated fat
7.405g
0.536g
46%
Vitamin B2
0.62mg
0.055mg
43%
Vitamin A
271µg
9µg
29%
Fats
17.9g
1.54g
25%
Calcium
275mg
59mg
22%
Sodium
1500mg
1072mg
19%
Saturated fat
4.06g
0.133g
18%
Vitamin D*
117 IU
15%
Vitamin D
2.9µg
15%
Vitamin E
1.89mg
13%
Protein
24.6g
19.35g
11%
Phosphorus
356mg
280mg
11%
Vitamin B1
0.19mg
0.053mg
11%
Vitamin B6
0.32mg
0.18mg
11%
Monounsaturated fat
4.631g
0.185g
11%
Calories
264kcal
97kcal
8%
Vitamin C
0mg
7.6mg
8%
Vitamin B3
0.12mg
1.34mg
8%
Potassium
181mg
262mg
2%
Carbs
4g
0g
1%
Vitamin K
0.6µg
1%
Protein per 100 calories
9.3g
20g
N/A
Calories per 10 g protein
107kcal
50kcal
N/A
Weight per 100 calories
38g
103g
N/A
Unsaturated / Saturated Fat ratio
3
5.4
N/A
Net carbs
4g
0g
N/A
Manganese
0.05mg
0.04mg
0%
Folate
50µg
51µg
0%
Tryptophan
0.323mg
0.269mg
0%
Threonine
1.263mg
0.783mg
0%
Isoleucine
1.035mg
0.938mg
0%
Leucine
2.133mg
1.536mg
0%
Lysine
1.834mg
1.684mg
0%
Methionine
0.646mg
0.545mg
0%
Phenylalanine
1.071mg
0.817mg
0%
Valine
1.263mg
0.91mg
0%
Histidine
0.649mg
0.393mg
0%
Omega-3 - EPA
2.741g
0.295g
N/A
Omega-3 - DHA
3.8g
0.118g
N/A
Omega-3 - DPA
0.229g
0.031g
N/A
Macronutrient Comparison
Macronutrient breakdown side-by-side comparison
4
25%
18%
4%
48%
6%
Protein:
24.6 g
Fats:
17.9 g
Carbs:
4 g
Water:
47.5 g
Other:
6 g
1
19%
78%
Protein:
19.35 g
Fats:
1.54 g
Carbs:
0 g
Water:
77.55 g
Other:
1.56 g
Contains
more
Protein Protein
+27.1%
Contains
more
Fats Fats
+1062.3%
Contains
more
Carbs Carbs
+∞%
Contains
more
Other Other
+284.6%
Contains
more
Water Water
+63.3%
Fat Type Comparison
Fat type breakdown side-by-side comparison
2
25%
29%
46%
Saturated fat:
Sat. Fat
4.06 g
Monounsaturated fat:
Mono. Fat
4.631 g
Polyunsaturated fat:
Poly. Fat
7.405 g
1
16%
22%
63%
Saturated fat:
Sat. Fat
0.133 g
Monounsaturated fat:
Mono. Fat
0.185 g
Polyunsaturated fat:
Poly. Fat
0.536 g
Contains
more
Mono. Fat Monounsaturated fat
+2403.2%
Contains
more
Poly. Fat Polyunsaturated fat
+1281.5%
Contains
less
Sat. Fat Saturated fat
-96.7%