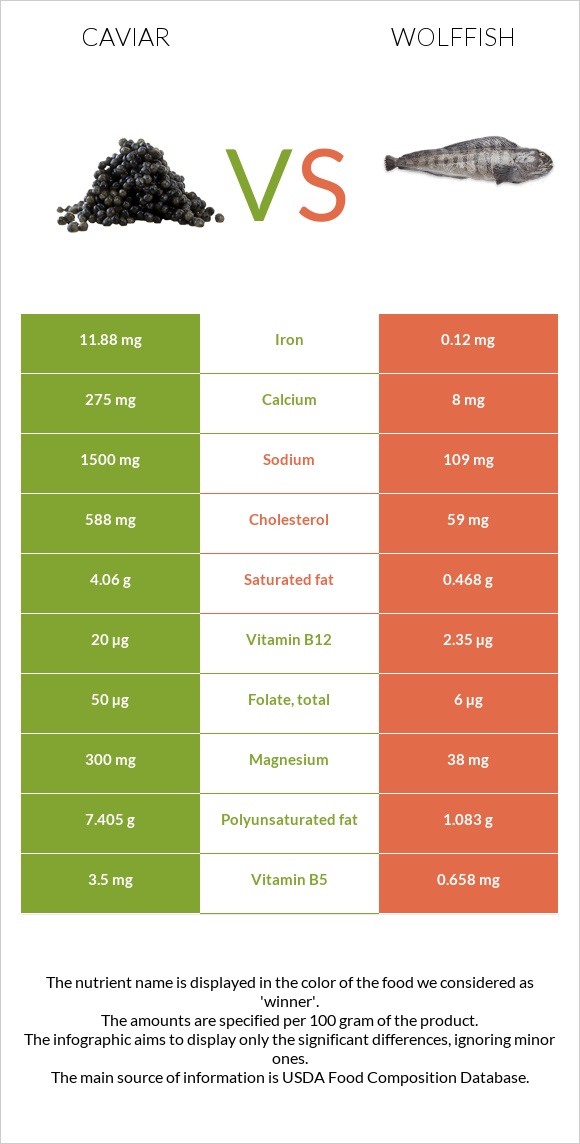
What are the main differences between caviar and wolffish? Wolffish has less vitamin B12, iron, magnesium, vitamin B5, vitamin B2, selenium, and calcium than caviar. Caviar's daily need coverage for vitamin B12 is 735% higher. Caviar has 99 times more iron than wolffish. Caviar has 11.88mg of iron, while wolffish has 0.12mg. Wolffish contains less sodium. We used Fish, caviar, black, and red, granular and Fish, wolffish, Atlantic, cooked, dry heat types in this comparison.
Infographic
Mineral Comparison
Mineral comparison score is based on the number of minerals by which one or the other food is richer. The "coverage" charts below show how much of the daily needs can be covered by 300 grams of the food.
7
100 g
300 g
1 tbsp - 16g 1 oz - 28.35g
Magnesium
Magnesium
Calcium
Calcium
Potassium
Potassium
Iron
Iron
Copper
Copper
Zinc
Zinc
Phosphorus
Phosphorus
Sodium
Sodium
Manganese
Manganese
Selenium
Selenium
214%
83%
16%
446%
37%
26%
153%
196%
6.5%
357%
2
100 g
300 g
3 oz - 85g 0.5 fillet - 119g
Magnesium
Magnesium
Calcium
Calcium
Potassium
Potassium
Iron
Iron
Copper
Copper
Zinc
Zinc
Phosphorus
Phosphorus
Sodium
Sodium
Manganese
Manganese
Selenium
Selenium
27%
2.4%
34%
4.5%
12%
27%
110%
14%
2.5%
255%
Vitamin Comparison
Vitamin comparison score is based on the number of vitamins by which one or the other food is richer. The "coverage" charts below show how much of the daily needs can be covered by 300 grams of the food.
8
100 g
300 g
1 tbsp - 16g 1 oz - 28.35g
Vitamin C
Vit. C
Vitamin D
Vit. D
Vitamin A
Vit. A
Vitamin E
Vit. E
Vitamin B1
Vit. B1
Vitamin B2
Vit. B2
Vitamin B3
Vit. B3
Vitamin B5
Vit. B5
Vitamin B6
Vit. B6
Vitamin B12
Vit. B12
Vitamin K
Vit. K
Folate
Folate
0%
44%
90%
38%
48%
143%
2.3%
210%
74%
2500%
1.5%
38%
2
100 g
300 g
3 oz - 85g 0.5 fillet - 119g
Vitamin C
Vit. C
Vitamin D
Vit. D
Vitamin A
Vit. A
Vitamin E
Vit. E
Vitamin B1
Vit. B1
Vitamin B2
Vit. B2
Vitamin B3
Vit. B3
Vitamin B5
Vit. B5
Vitamin B6
Vit. B6
Vitamin B12
Vit. B12
Vitamin K
Vit. K
Folate
Folate
0%
0%
43%
0%
52%
22%
49%
39%
107%
294%
0%
4.5%
All nutrients comparison - raw data values
Nutrient
DV% diff.
Vitamin B12
20µg
2.35µg
735%
Cholesterol
588mg
59mg
176%
Iron
11.88mg
0.12mg
147%
Choline
490.9mg
89%
Magnesium
300mg
38mg
62%
Sodium
1500mg
109mg
60%
Vitamin B5
3.5mg
0.658mg
57%
Polyunsaturated fat
7.405g
1.083g
42%
Vitamin B2
0.62mg
0.097mg
40%
Selenium
65.5µg
46.8µg
34%
Calcium
275mg
8mg
27%
Fats
17.9g
3.06g
23%
Vitamin A
271µg
130µg
16%
Saturated fat
4.06g
0.468g
16%
Vitamin D*
117 IU
15%
Vitamin D
2.9µg
15%
Vitamin B3
0.12mg
2.598mg
15%
Phosphorus
356mg
256mg
14%
Vitamin E
1.89mg
13%
Vitamin B6
0.32mg
0.462mg
11%
Folate
50µg
6µg
11%
Monounsaturated fat
4.631g
1.072g
9%
Copper
0.11mg
0.037mg
8%
Calories
264kcal
123kcal
7%
Potassium
181mg
385mg
6%
Protein
24.6g
22.44g
4%
Vitamin B1
0.19mg
0.208mg
2%
Carbs
4g
0g
1%
Manganese
0.05mg
0.019mg
1%
Vitamin K
0.6µg
1%
Protein per 100 calories
9.3g
18g
N/A
Calories per 10 g protein
107kcal
55kcal
N/A
Weight per 100 calories
38g
81g
N/A
Unsaturated / Saturated Fat ratio
3
4.6
N/A
Net carbs
4g
0g
N/A
Zinc
0.95mg
1mg
0%
Tryptophan
0.323mg
0.251mg
0%
Threonine
1.263mg
0.984mg
0%
Isoleucine
1.035mg
1.034mg
0%
Leucine
2.133mg
1.824mg
0%
Lysine
1.834mg
2.061mg
0%
Methionine
0.646mg
0.664mg
0%
Phenylalanine
1.071mg
0.876mg
0%
Valine
1.263mg
1.156mg
0%
Histidine
0.649mg
0.661mg
0%
Omega-3 - EPA
2.741g
0.393g
N/A
Omega-3 - DHA
3.8g
0.405g
N/A
Omega-3 - DPA
0.229g
0.055g
N/A
Macronutrient Comparison
Macronutrient breakdown side-by-side comparison
4
25%
18%
4%
48%
6%
Protein:
24.6 g
Fats:
17.9 g
Carbs:
4 g
Water:
47.5 g
Other:
6 g
1
22%
3%
74%
Protein:
22.44 g
Fats:
3.06 g
Carbs:
0 g
Water:
74.23 g
Other:
0.27 g
Contains
more
Fats Fats
+485%
Contains
more
Carbs Carbs
+∞%
Contains
more
Other Other
+2122.2%
Contains
more
Water Water
+56.3%
~equal in
Protein
~22.44g
Fat Type Comparison
Fat type breakdown side-by-side comparison
2
25%
29%
46%
Saturated fat:
Sat. Fat
4.06 g
Monounsaturated fat:
Mono. Fat
4.631 g
Polyunsaturated fat:
Poly. Fat
7.405 g
1
18%
41%
41%
Saturated fat:
Sat. Fat
0.468 g
Monounsaturated fat:
Mono. Fat
1.072 g
Polyunsaturated fat:
Poly. Fat
1.083 g
Contains
more
Mono. Fat Monounsaturated fat
+332%
Contains
more
Poly. Fat Polyunsaturated fat
+583.7%
Contains
less
Sat. Fat Saturated fat
-88.5%