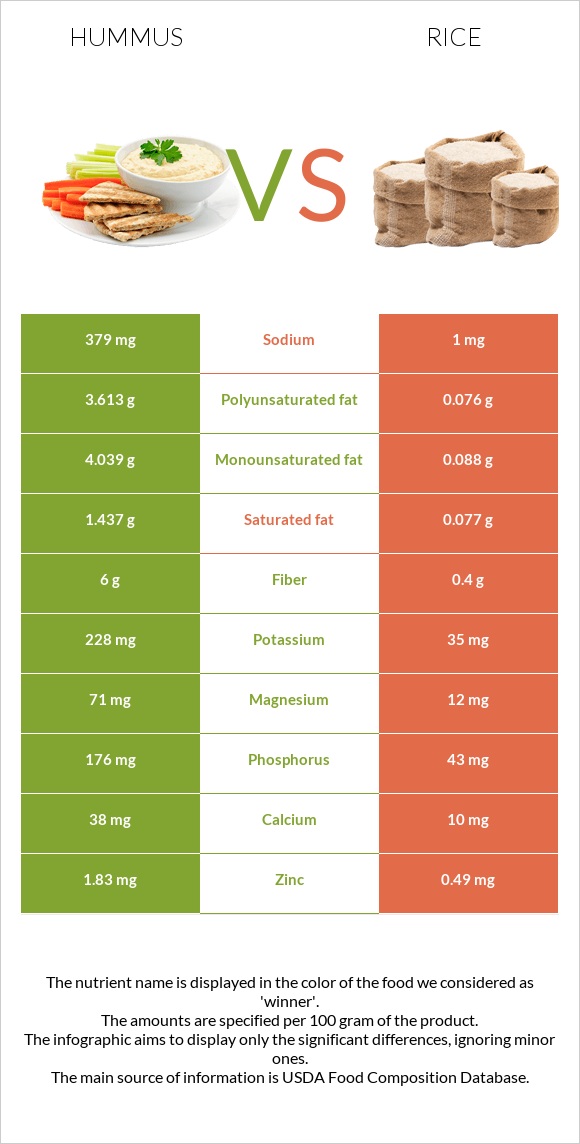
Summary of differences between hummus and rice Hummus has more copper, fiber, phosphorus, iron, magnesium, manganese, zinc, and vitamin B6; however, rice is higher in selenium. Hummus covers your daily need for copper, 51% more than rice. Hummus has 379 times more sodium than rice. While hummus has 379mg of sodium, rice has only 1mg. The glycemic index of rice is higher. These are the specific foods used in this comparison Hummus, commercial and Rice, white, long-grain, regular, enriched, cooked .
Infographic
Mineral Comparison
Mineral comparison score is based on the number of minerals by which one or the other food is richer. The "coverage" charts below show how much of the daily needs can be covered by 300 grams of the food.
8
100 g
300 g
1 tbsp - 15g 1 cup - 246g
Magnesium
Magnesium
Calcium
Calcium
Potassium
Potassium
Iron
Iron
Copper
Copper
Zinc
Zinc
Phosphorus
Phosphorus
Sodium
Sodium
Manganese
Manganese
Selenium
Selenium
51%
11%
20%
92%
176%
50%
75%
49%
101%
14%
2
100 g
300 g
1 cup - 158g
Magnesium
Magnesium
Calcium
Calcium
Potassium
Potassium
Iron
Iron
Copper
Copper
Zinc
Zinc
Phosphorus
Phosphorus
Sodium
Sodium
Manganese
Manganese
Selenium
Selenium
8.6%
3%
3.1%
45%
23%
13%
18%
0.13%
62%
41%
Vitamin Comparison
Vitamin comparison score is based on the number of vitamins by which one or the other food is richer. The "coverage" charts below show how much of the daily needs can be covered by 300 grams of the food.
3
100 g
300 g
1 tbsp - 15g 1 cup - 246g
Vitamin C
Vit. C
Vitamin D
Vit. D
Vitamin A
Vit. A
Vitamin E
Vit. E
Vitamin B1
Vit. B1
Vitamin B2
Vit. B2
Vitamin B3
Vit. B3
Vitamin B5
Vit. B5
Vitamin B6
Vit. B6
Vitamin B12
Vit. B12
Vitamin K
Vit. K
Folate
Folate
0%
0%
0%
0%
45%
15%
11%
7.9%
46%
0%
0%
62%
3
100 g
300 g
1 cup - 158g
Vitamin C
Vit. C
Vitamin D
Vit. D
Vitamin A
Vit. A
Vitamin E
Vit. E
Vitamin B1
Vit. B1
Vitamin B2
Vit. B2
Vitamin B3
Vit. B3
Vitamin B5
Vit. B5
Vitamin B6
Vit. B6
Vitamin B12
Vit. B12
Vitamin K
Vit. K
Folate
Folate
0%
0%
0%
0.8%
41%
3%
28%
23%
21%
0%
0%
44%
All nutrients comparison - raw data values
Nutrient
DV% diff.
Copper
0.527mg
0.069mg
51%
Polyunsaturated fat
3.613g
0.076g
24%
Fiber
6g
0.4g
22%
Phosphorus
176mg
43mg
19%
Iron
2.44mg
1.2mg
16%
Sodium
379mg
1mg
16%
Fats
9.6g
0.28g
14%
Magnesium
71mg
12mg
14%
Manganese
0.773mg
0.472mg
13%
Zinc
1.83mg
0.49mg
12%
Protein
7.9g
2.69g
10%
Monounsaturated fat
4.039g
0.088g
10%
Selenium
2.6µg
7.5µg
9%
Vitamin B6
0.2mg
0.093mg
8%
Potassium
228mg
35mg
6%
Vitamin B3
0.582mg
1.476mg
6%
Folate
83µg
58µg
6%
Saturated fat
1.437g
0.077g
6%
Carbs
14.29g
28.17g
5%
Vitamin B5
0.132mg
0.39mg
5%
Vitamin B2
0.064mg
0.013mg
4%
Calcium
38mg
10mg
3%
Calories
166kcal
130kcal
2%
Vitamin B1
0.18mg
0.163mg
1%
Protein per 100 calories
4.8g
2.1g
N/A
Calories per 10 g protein
210kcal
483kcal
N/A
Weight per 100 calories
60g
77g
N/A
Unsaturated / Saturated Fat ratio
5.3
2.1
N/A
Net carbs
8.29g
27.77g
N/A
Sugar
0.05g
N/A
Vitamin E
0.04mg
0%
Choline
2.1mg
0%
Tryptophan
0.031mg
0%
Threonine
0.096mg
0%
Isoleucine
0.116mg
0%
Leucine
0.222mg
0%
Lysine
0.097mg
0%
Methionine
0.063mg
0%
Phenylalanine
0.144mg
0%
Valine
0.164mg
0%
Histidine
0.063mg
0%
Macronutrient Comparison
Macronutrient breakdown side-by-side comparison
3
8%
10%
14%
67%
Protein:
7.9 g
Fats:
9.6 g
Carbs:
14.29 g
Water:
66.59 g
Other:
1.62 g
2
3%
28%
68%
Protein:
2.69 g
Fats:
0.28 g
Carbs:
28.17 g
Water:
68.44 g
Other:
0.42 g
Contains
more
Protein Protein
+193.7%
Contains
more
Fats Fats
+3328.6%
Contains
more
Other Other
+285.7%
Contains
more
Carbs Carbs
+97.1%
Fat Type Comparison
Fat type breakdown side-by-side comparison
2
16%
44%
40%
Saturated fat:
Sat. Fat
1.437 g
Monounsaturated fat:
Mono. Fat
4.039 g
Polyunsaturated fat:
Poly. Fat
3.613 g
1
32%
37%
32%
Saturated fat:
Sat. Fat
0.077 g
Monounsaturated fat:
Mono. Fat
0.088 g
Polyunsaturated fat:
Poly. Fat
0.076 g
Contains
more
Mono. Fat Monounsaturated fat
+4489.8%
Contains
more
Poly. Fat Polyunsaturated fat
+4653.9%
Contains
less
Sat. Fat Saturated fat
-94.6%