Taco seasoning vs. Dill seeds — In-Depth Nutrition Comparison
Compare
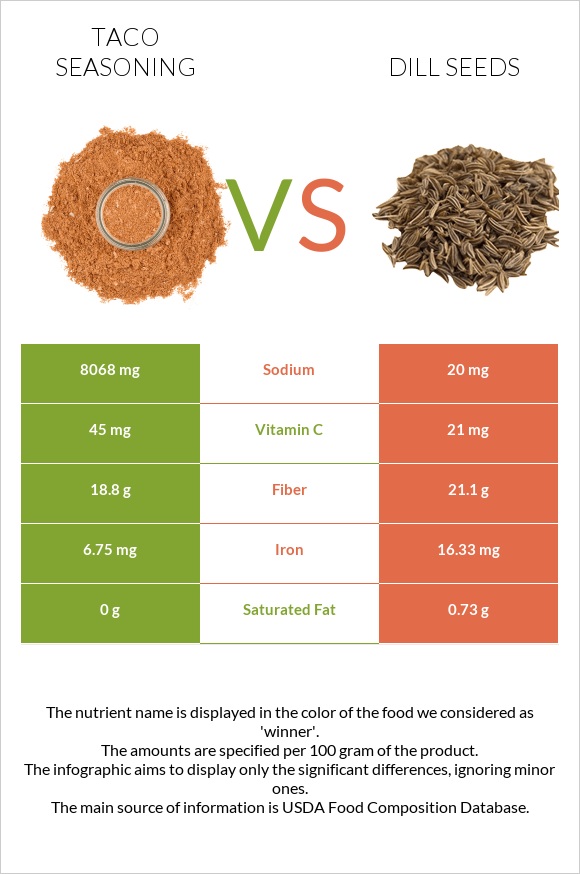
How are taco seasoning and dill seeds different?
- Taco seasoning is higher in vitamin A and vitamin C; however, dill seeds are richer in iron and fiber.
- Daily need coverage for sodium for taco seasoning is 350% higher.
- Taco seasoning contains 177 times more vitamin A than dill seeds. While taco seasoning contains 9381 IU of vitamin A, dill seeds contain only 53 IU.
- Dill seeds have less sodium.
PACE, Dry Taco Seasoning Mix and Spices, dill seed are the varieties used in this article.
Infographic
Infographic link
Mineral Comparison
Mineral comparison score is based on the number of minerals by which one or the other food is richer. The "coverage" charts below show how much of the daily needs can be covered by 300 grams of the food.
| Contains more IronIron | +141.9% |
| Contains less SodiumSodium | -99.8% |
Vitamin Comparison
Vitamin comparison score is based on the number of vitamins by which one or the other food is richer. The "coverage" charts below show how much of the daily needs can be covered by 300 grams of the food.
| Contains more Vitamin CVitamin C | +114.3% |
All nutrients comparison - raw data values
| Nutrient |  |
 |
DV% diff. |
| Sodium | 8068mg | 20mg | 350% |
| Calcium | 1516mg | 152% | |
| Iron | 6.75mg | 16.33mg | 120% |
| Copper | 0.78mg | 87% | |
| Manganese | 1.833mg | 80% | |
| Magnesium | 256mg | 61% | |
| Zinc | 5.2mg | 47% | |
| Phosphorus | 277mg | 40% | |
| Potassium | 1186mg | 35% | |
| Vitamin B1 | 0.418mg | 35% | |
| Protein | 0g | 15.98g | 32% |
| Vitamin C | 45mg | 21mg | 27% |
| Monounsaturated fat | 9.41g | 24% | |
| Fats | 0g | 14.54g | 22% |
| Selenium | 12.1µg | 22% | |
| Vitamin B2 | 0.284mg | 22% | |
| Vitamin B6 | 0.25mg | 19% | |
| Vitamin B3 | 2.807mg | 18% | |
| Fiber | 18.8g | 21.1g | 9% |
| Polyunsaturated fat | 1.01g | 7% | |
| Calories | 188kcal | 305kcal | 6% |
| Folate | 10µg | 3% | |
| Saturated fat | 0g | 0.73g | 3% |
| Protein per 100 calories | 0g | 5.2g | N/A |
| Calories per 10 g protein | 191kcal | N/A | |
| Weight per 100 calories | 53g | 33g | N/A |
| Unsaturated / Saturated Fat ratio | 14 | N/A | |
| Net carbs | 37.49g | 34.07g | N/A |
| Carbs | 56.29g | 55.17g | 0% |
| Sugar | 18.76g | N/A | |
| Vitamin A | 3µg | 0% | |
| Threonine | 0.575mg | 0% | |
| Isoleucine | 0.767mg | 0% | |
| Leucine | 0.925mg | 0% | |
| Lysine | 1.038mg | 0% | |
| Methionine | 0.143mg | 0% | |
| Phenylalanine | 0.67mg | 0% | |
| Valine | 1.12mg | 0% | |
| Histidine | 0.32mg | 0% |
Macronutrient Comparison
Macronutrient breakdown side-by-side comparison
Protein:
0 g
Fats:
0 g
Carbs:
56.29 g
Water:
5.7 g
Other:
38.01 g
Protein:
15.98 g
Fats:
14.54 g
Carbs:
55.17 g
Water:
7.7 g
Other:
6.61 g
| Contains more OtherOther | +475% |
| Contains more ProteinProtein | +∞% |
| Contains more FatsFats | +∞% |
| Contains more WaterWater | +35.1% |
~equal in
Carbs
~55.17g


