Graham cracker nutrition: calories, carbs, GI, protein, fiber, fats
Carbs in Graham cracker
100g of Graham crackers contain 78g carbs, which covers 26% of the daily need (in the case of a 2000 calorie diet).
Compared to all foods in our database, Graham crackers are in the top 6% of foods high in carbs and the top 5% of foods high in net carbs.
Carbs per serving size
One Graham cracker (15g) contains 11.7g of carbs, whereas 1 oz of crackers (28.35g) contains 22g.
One cup of crushed Grahams (84g) contains 65.3g of carbs.
Different types
Low-fat Grahams have lower fat and slightly higher water content, but the carb content remains the same.
Surprisingly, chocolate-coated Grahams are lower in carbs. One hundred grams of chocolate-coated Grahams contains 67g of carbs.
Carbohydrate type breakdown
The chart below shows that most carbs in Grahams that break down to simple sugars are starch and sucrose, starch being two times more.
Carbohydrate type breakdown
Graham cracker net carbs
Over 95% of Graham crackers’ carbs are net carbs, equal to 77.26g per 100g serving. The remaining 5% is dietary fiber, which equals 3.4g per 100g serving.
Graham cracker calories
Calories per 100g
Graham cracker is a high-calorie food. One hundred grams of Graham crackers provides 430 calories. Most of the calories are provided by the high carb content.
To cover the daily carb need, a person needs to consume 384g of Grahams.
Macronutrients chart
Calories per serving size
One Graham cracker (15g), either plain or honey, provides 64.5 calories, whereas 1 oz of crackers (28.35g) provides 122 calories.
One cup of crushed Grahams weighing 84g provides 361 calories.
Comparison
Compared to all foods in our database, Graham crackers are in the top 12% of foods high in calories.
Each gram of fats provides over two times more calories than carbs. Plain or honey Grahams have a higher level of carbs, whereas other cookies and crackers (except for saltine crackers) mentioned in the table below have higher levels of fats.
| Food | Calories, 1 oz | Calories, per 100g |
| Grahams, chocolate-coated | 142 | 500 |
| Cheese cracker | 139 | 489 |
| Chocolate chip cookie | 138 | 488 |
| Cream cracker | - | 484 |
| Grahams, plain or honey | 122 | 430 |
| Marshmallow cookie | 119 | 421 |
| Saltine cracker | 119 | 418 |
| Brownie cookie | 115 | 405 |
Summary table & burning estimates
We have calculated the duration and number of calories a person will burn by performing a certain type of activity, measured by a method called Met or Metabolic Equivalent of a Task (1, 2).
The table below shows the time and type of activity a person should perform to burn 64.5 calories provided from 1 Graham cracker.
| 60kg person | 80kg person | 100kg person | |
| Walking | 19 min | 14 min | 11.5 min |
| Running | 6 min | 4.5 min | 3.5 min |
| Cycling | 9 min | 6.5 min | 5.5 min |
| Aerobics | 9 min | 7 min | 5.5 min |
References

Top nutrition facts for Graham cracker
| Calories ⓘ Calories for selected serving | 430 kcal |
|
Glycemic index ⓘ
Source:
Check out our Glycemic index chart page for the full list.
|
74 (high) |
| Glycemic load ⓘ Glycemic Load (GL) is a metric that measures both the quality (Glycemic Index) and quantity of carbohydrates in a specific serving of food to estimate its impact on blood sugar levels. It is calculated as: (GI × Carbs in grams) / 100. | 8 (low) |
| Net carbs ⓘ Net Carbs = Total Carbohydrates – Fiber – Sugar Alcohols | 74 g |
| Default serving size ⓘ Serving sizes are mostly taken from FDA's Reference Amounts Customarily Consumed (RACCs) | 1 cracker (15 g) |
| Acidity (Based on PRAL) ⓘ PRAL (Potential renal acid load) is calculated using a formula. On the PRAL scale the higher the positive value, the more is the acidifying effect on the body. The lower the negative value, the higher the alkalinity of the food. 0 is neutral. | 4.5 (acidic) |
| Oxalates | 36 mg ⓘ https://www.researchgate.net/publication/223499374 |
Graham cracker calories (kcal)
| Calories for different serving sizes of graham cracker | Calories | Weight |
|---|---|---|
| Calories in 100 grams | 430 | |
| Calories in 1 large rectangular piece or 2 squares or 4 small rectangular pieces | 60 | 14 g |
| Calories in 1 cracker | 65 | 15 g |
| Calories in 1 oz | 122 | 28.35 g |
| Calories in 1 cup, crushed | 361 | 84 g |
| Calories for different varieties of graham cracker | Calories | Weight |
|---|---|---|
| Cookies, graham crackers, plain or honey (includes cinnamon) (this food) | 430 | 100 g |
| Cookies, graham crackers, plain or honey, lowfat | 386 | 100 g |
Extra Nutrition facts for Graham cracker
| Protein per 100 calories ⓘ Shows how many grams of protein you get from 100 calories of this food, calculated as (protein in g ÷ calories) × 100. | 1.6 g |
| Calories per 10 g protein ⓘ Shows how many calories you need to eat from this food to get 10 g of protein, calculated as (calories ÷ protein in g) × 10. | 643 kcal |
| Weight per 100 calories ⓘ Shows how many grams of this food equal 100 kcal—higher grams mean a larger portion for the same calories. | 23 g |
| Unsaturated / Saturated Fat ratio ⓘ (monounsaturated + polyunsaturated) / saturated, ≥2 broadly recommended by major guidelines for heart health | 4.8 |
Graham cracker Glycemic index (GI)
Graham cracker Glycemic load (GL)
Mineral coverage chart
Mineral chart - relative view
Vitamin coverage chart
Vitamin chart - relative view
Fat type information
Fiber content ratio for Graham cracker
All nutrients for Graham cracker per 100g
| Nutrient | Value | DV% | In TOP % of foods | Comparison |
| Vitamin A | 0µg | 0% | 100% | |
| Calories | 430kcal | 22% | 12% |
9.1 times more than Orange
|
| Protein | 6.7g | 16% | 55% |
2.4 times more than Broccoli
|
| Weight per 100 calories | 23g | N/A | 88% | |
| Protein per 100 calories | 1.6g | N/A | 78% | |
| Calories per 10 g protein | 643kcal | N/A | 19% | |
| Fats | 11g | 16% | 33% |
3.1 times less than Cheese
|
| Unsaturated / Saturated Fat ratio | 4.8 | N/A | 12% | |
| Vitamin C | 0mg | 0% | 100% |
N/A
|
| Carbs | 78g | 26% | 6% |
2.8 times more than Rice
|
| Net carbs | 74g | N/A | 5% |
1.4 times more than Chocolate
|
| Cholesterol | 0mg | 0% | 100% |
N/A
|
| Vitamin D* | 0 IU | 0% | 100% |
N/A
|
| Vitamin D | 0µg | 0% | 100% |
N/A
|
| Magnesium | 40mg | 10% | 18% |
3.5 times less than Almonds
|
| Calcium | 77mg | 8% | 23% |
1.6 times less than Milk
|
| Potassium | 170mg | 5% | 62% |
1.2 times more than Cucumber
|
| Iron | 3.8mg | 47% | 13% |
1.5 times more than Beef broiled
|
| Sugar | 25g | N/A | 10% |
2.8 times more than Coca-Cola
|
| Fiber | 3.4g | 14% | 18% |
1.4 times more than Orange
|
| Copper | 0.17mg | 19% | 21% |
1.2 times more than Shiitake
|
| Zinc | 0.96mg | 9% | 47% |
6.6 times less than Beef broiled
|
| Starch | 47g | 19% | 2% |
3 times more than Potato
|
| Phosphorus | 185mg | 26% | 37% |
Equal to Chicken meat
|
| Sodium | 459mg | 20% | 22% |
1.1 times less than White bread
|
| Vitamin E | 1.5mg | 10% | 10% |
Equal to Kiwi
|
| Manganese | 1mg | 44% | 8% | |
| Selenium | 6.3µg | 11% | 46% | |
| Vitamin B1 | 0.27mg | 22% | 23% |
Equal to Pea raw
|
| Vitamin B2 | 0.32mg | 24% | 18% |
2.4 times more than Avocado
|
| Vitamin B3 | 4.4mg | 28% | 31% |
2.2 times less than Turkey meat
|
| Vitamin B5 | 0.42mg | 8% | 39% |
2.7 times less than Sunflower seeds
|
| Vitamin B6 | 0.16mg | 12% | 45% |
1.3 times more than Oats
|
| Vitamin B12 | 0µg | 0% | 100% |
N/A
|
| Vitamin K | 14µg | 12% | 8% |
7.1 times less than Broccoli
|
| Trans fat | 0.06g | N/A | 24% |
270.7 times less than Margarine
|
| Folate | 91µg | 23% | 11% |
1.5 times more than Brussels sprouts
|
| Saturated fat | 1.6g | 8% | 48% |
3.6 times less than Beef broiled
|
| Choline | 5.9mg | 1% | 45% | |
| Monounsaturated fat | 2.5g | N/A | 41% |
3.9 times less than Avocado
|
| Polyunsaturated fat | 5.4g | N/A | 10% |
8.8 times less than Walnut
|
| Fructose | 0.99g | 1% | 6% |
6 times less than Apple
|
| Caffeine | 0mg | 0% | 100% | |
| Omega-3 - EPA | 0g | N/A | 100% |
N/A
|
| Omega-3 - DHA | 0g | N/A | 100% |
N/A
|
| Omega-3 - ALA | 0.6g | N/A | 2% |
15.3 times less than Canola oil
|
| Omega-3 - DPA | 0g | N/A | 100% |
N/A
|
| Omega-3 - Eicosatrienoic acid | 0g | N/A | 100% | |
| Omega-6 - Gamma-linoleic acid | 0.02g | N/A | 2% | |
| Omega-6 - Dihomo-gamma-linoleic acid | 0g | N/A | 100% | |
| Omega-6 - Eicosadienoic acid | 0g | N/A | 13% | |
| Omega-6 - Linoleic acid | 4.7g | N/A | 3% |
2.6 times less than Almonds
|
Check out similar food or compare with current
NUTRITION FACTS LABEL
Serving Size ______________
Health checks
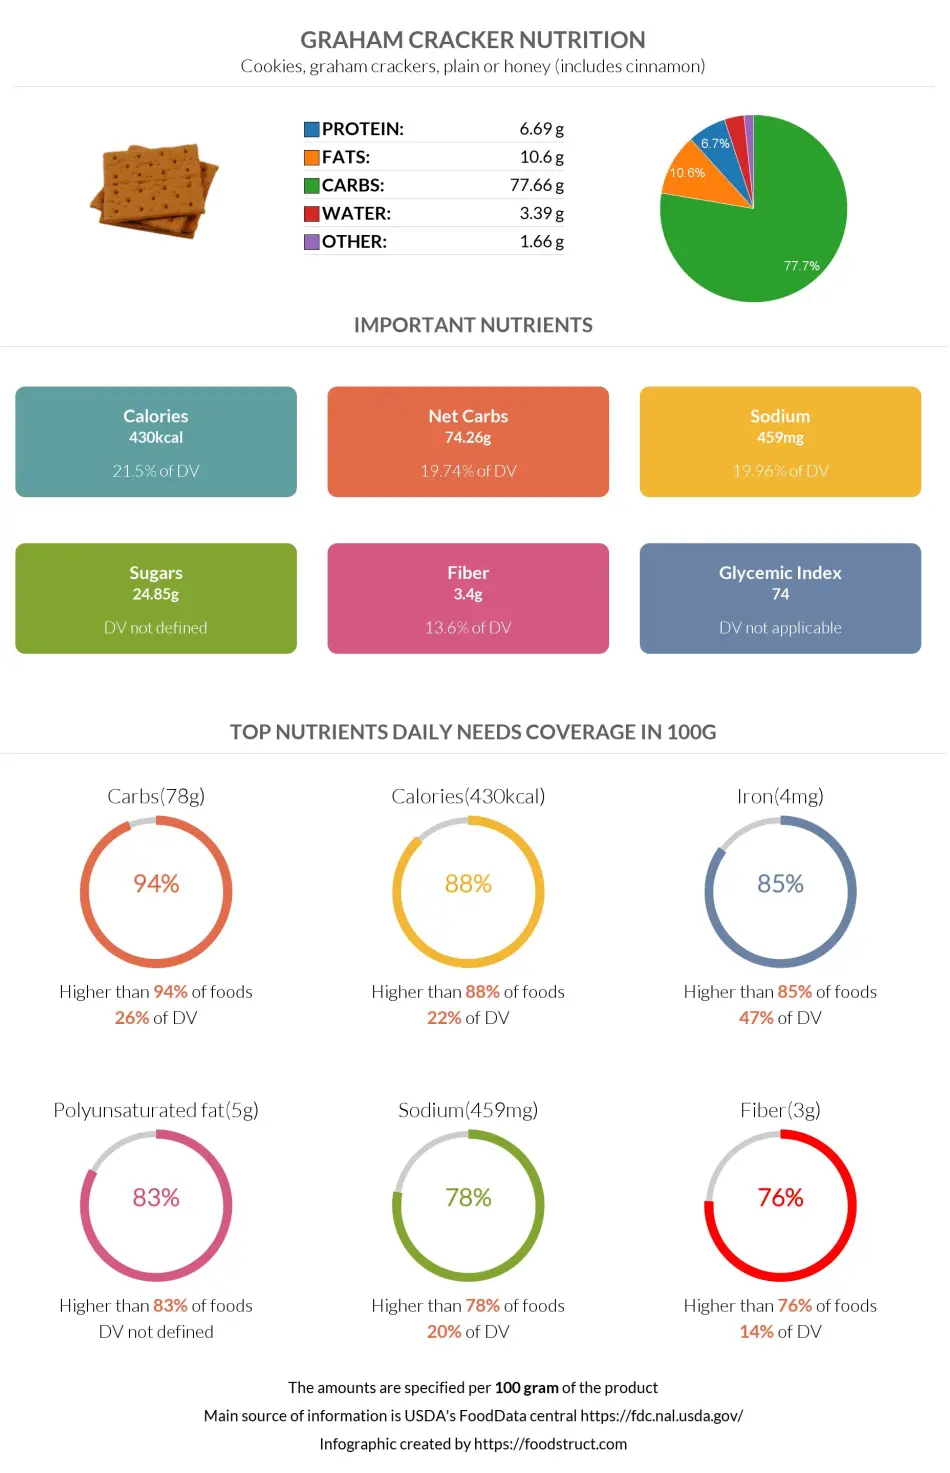
Graham cracker nutrition infographic
References
All the values for which the sources are not specified explicitly are taken from FDA’s Food Central. The exact link to the food presented on this page can be found below.