Kiwifruit nutrition: calories, carbs, GI, protein, fiber, fats
Kiwifruit Carbs
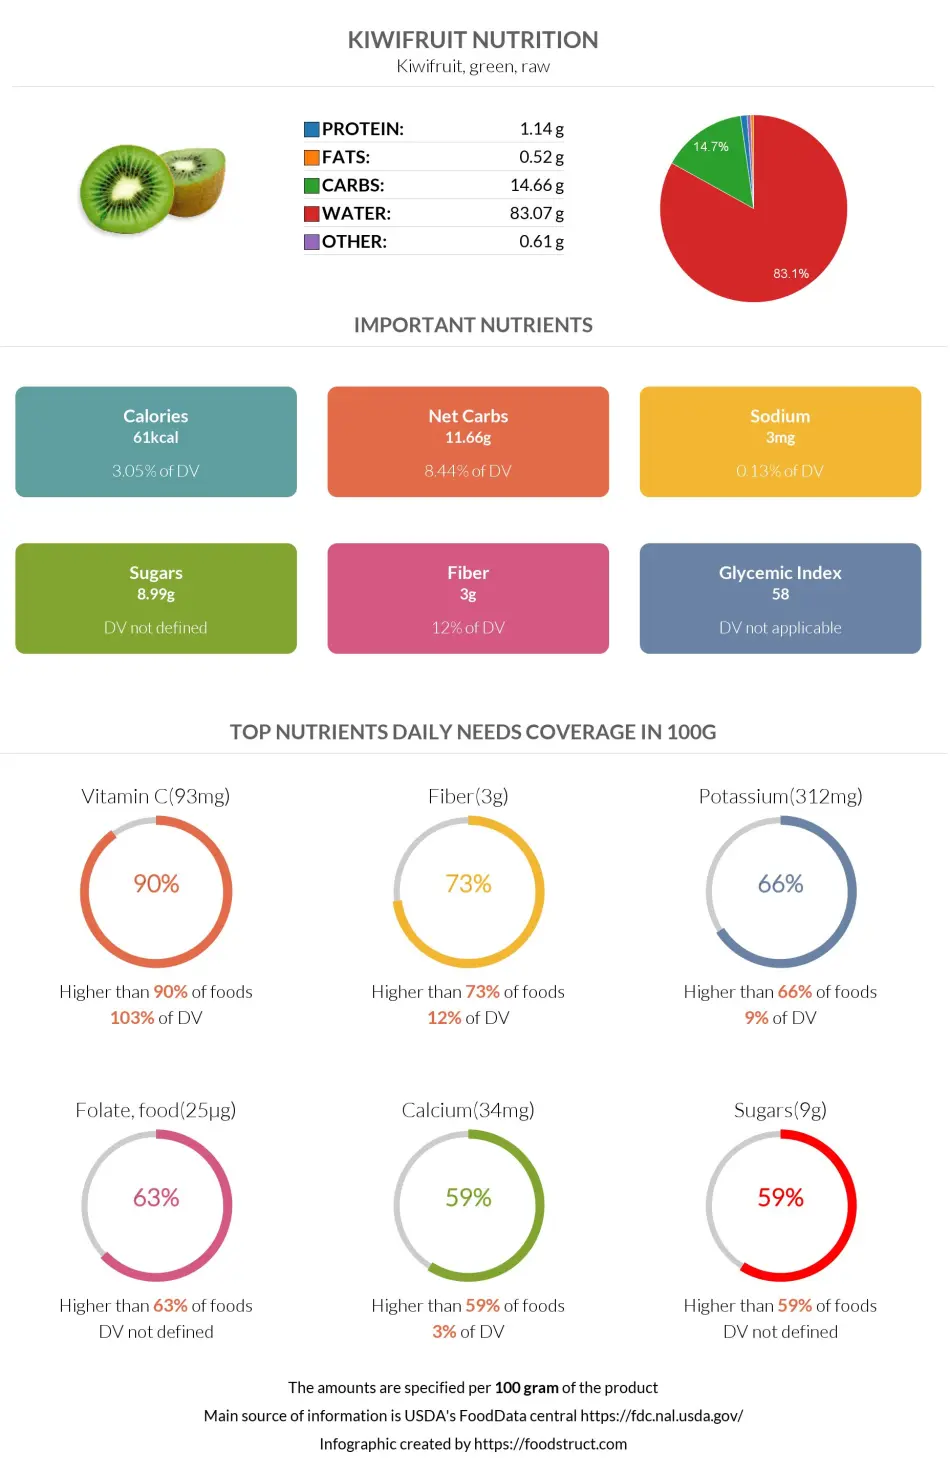
Kiwifruit or Chinese gooseberry is not dense in nutrients, consisting of 83% water. Of the remaining 17% of nutrients, almost 15% are carbs.
Macronutrients chart
Calories per 100g
One hundred grams of kiwifruit contains 14.66g of carbs, which covers 5% of the daily carb need (in the case of a 2000-calorie diet).
Carbs per serving size
The average serving size of kiwifruit is 1 NLEA (148g), one serving of which contains 21.8g of carbs.
One fruit, weighing 69g, contains 10.1g of carbs, which means one cup of sliced kiwifruit, weighing 180g, contains 26.5g of carbs.
Carbohydrate type breakdown
The primary two types of carbs in kiwifruit are glucose and fructose, in similar amounts. However, a low level of sucrose, maltose, and galactose is also present in kiwifruit.
Carbohydrate type breakdown
Net carbs
From 14.66g of total carbs in kiwifruit, 11.66g or 79% are net carbs. Kiwifruit is not the best option for low-carb diets; it can be consumed at moderate levels.
Soluble or insoluble fiber
Most of the dietary fiber in kiwifruit is insoluble: 77% insoluble fiber and 23% soluble fiber (1).
Kiwifruit contains 3.39g of dietary fiber, 2.61g of which is insoluble
The high level of insoluble fiber may help during constipation, making the food move faster and increasing stool bulk and frequency.
Fiber content ratio for Kiwifruit
Kiwifruit Calories
Calories per 100g
Kiwifruit is low in calories. One hundred grams of kiwifruit provides 61 calories, primarily by carbs.
Calories per serving size
One average or 1 NLEA (148g) serving of kiwifruit provides 90.3 calories.
One kiwifruit (69g) provides 42.1 calories, so one cup of kiwifruit (180g) provides 110 calories.
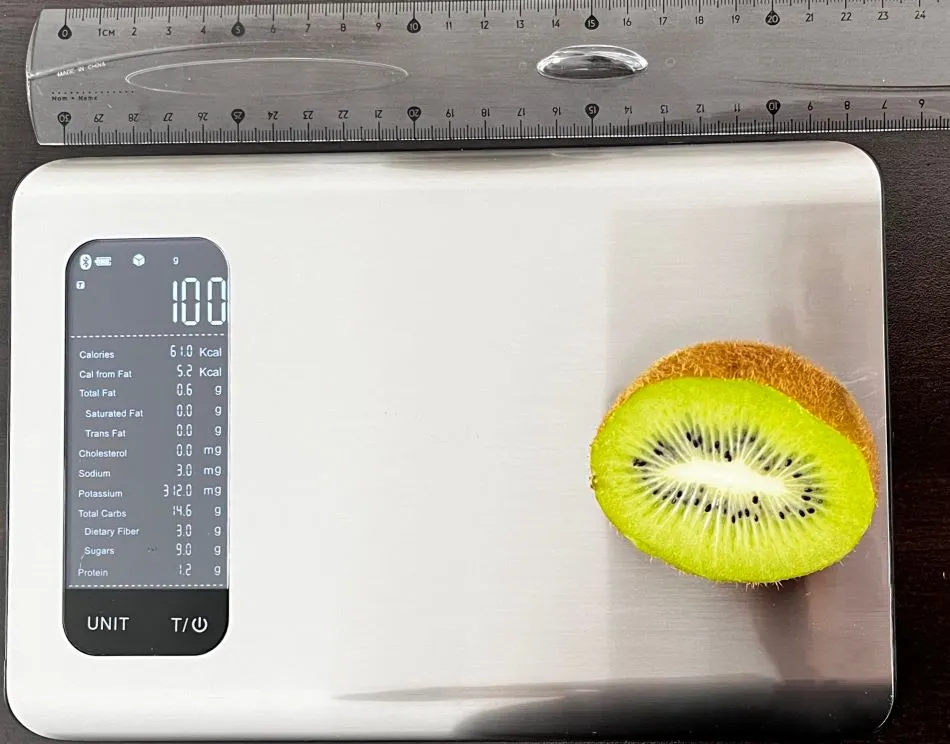
What Do 61 Calories or 100 Grams of Kiwifruit Look Like?
The picture below shows what 100 grams of kiwi looks like to help you visualize its weight and calories. As you can see, about half of the middle-sized kiwi make up 100 grams or 61 calories, meaning one whole kiwi is about 200 grams or 120 calories. Remember that calorie numbers can vary depending on the size and ripeness of the kiwi.
Comparison
Compared to all foods in our database, kiwifruit is in the top 17% of foods low in calories.
From the below-mentioned foods, only sapodilla has higher fat and carb contents, whereas compared to the others, kiwifruit is richer in fats, carbs, and proteins.
To know more about the differences between lemon and kiwifruit, you can visit our Kiwifruit vs. Lemon page.
| Food | Calories per serving | Calories per 100g |
| Sapodilla (chico, chikoo) | 141 (1 fruit, 170g) | 83 |
| Kiwifruit | 90.3 (1 NLEA) | 61 |
| Apple, with skin | 65 (1 cup, 125g) | 52 |
| Orange | 61.6 (1 fruit, 131g) | 47 |
| Strawberry | 47 (1 NLEA, 147g) | 32 |
| Lemon | 16.8 (1 NLEA, 58g) | 29 |
Summary table & burning estimates
We have calculated the duration and number of calories a person will burn by performing a certain type of activity, measured by a method called Met or Metabolic Equivalent of a Task (2, 3).
The table below shows the time and type of activity a person should perform to burn 90.3 calories from 1 NLEA serving of kiwifruit.
| 60kg person | 80kg person | 100kg person | |
| Walking | 26 min | 20 min | 16 min |
| Running | 8.5 min | 6.5 min | 5 min |
| Bicycling | 12.5 min | 9.5 min | 7.5 min |
| Aerobics | 12.5 min | 9.5 min | 7.5 min |
References
- https://www.ncbi.nlm.nih.gov/pmc/articles/PMC3614039/
- https://www.ncbi.nlm.nih.gov/pmc/articles/PMC4428382/
- 2011 Compendium of Physical Activities

Important nutritional characteristics for Kiwifruit
|
Glycemic index ⓘ
Source: Check out our full article on Kiwifruit glycemic index https://www.sciencedirect.com/science/article/pii/S0002916522004944Golden kiwi 43 https://www.ncbi.nlm.nih.gov/pmc/articles/PMC3208016/
Check out our Glycemic index chart page for the full list.
|
58 (medium) |
| Calories ⓘ Calories for selected serving | 110 kcal |
| Net Carbs ⓘ Net Carbs = Total Carbohydrates – Fiber – Sugar Alcohols | 21 grams |
| Acidity (Based on PRAL) ⓘ PRAL (Potential renal acid load) is calculated using a formula. On the PRAL scale the higher the positive value, the more is the acidifying effect on the body. The lower the negative value, the higher the alkalinity of the food. 0 is neutral. | -5.6 (alkaline) |
| Oxalates ⓘ https://www.researchgate.net/publication/259133562 | 36 mg |
Kiwifruit calories (kcal)
| Serving Size | Calories | Weight |
|---|---|---|
| Calories in 100 grams | 61 | |
| Calories in 1 cup, sliced | 110 | 180 g |
| Calories in 1 NLEA serving | 90 | 148 g |
Kiwifruit Glycemic index (GI)
Mineral coverage chart
Mineral chart - relative view
Vitamin coverage chart
Vitamin chart - relative view
Protein quality breakdown
Fat type information
All nutrients for Kiwifruit per selected serving size (1 cup, sliced - 180g)
| Nutrient | Value | DV% | In TOP % of foods | Comparison |
| Calories | 110kcal | 5% | 83% |
1.3 times more than Orange
|
| Protein | 2.1g | 5% | 84% |
2.5 times less than Broccoli
|
| Fats | 0.94g | 1% | 80% |
64.1 times less than Cheese
|
| Vitamin C | 167mg | 185% | 10% |
1.7 times more than Lemon
|
| Net carbs | 21g | N/A | 43% |
4.6 times less than Chocolate
|
| Carbs | 26g | 9% | 41% |
1.9 times less than Rice
|
| Cholesterol | 0mg | 0% | 100% |
N/A
|
| Vitamin D | 0µg | 0% | 100% |
N/A
|
| Magnesium | 31mg | 7% | 68% |
8.2 times less than Almond
|
| Calcium | 61mg | 6% | 41% |
3.7 times less than Milk
|
| Potassium | 562mg | 17% | 34% |
2.1 times more than Cucumber
|
| Iron | 0.56mg | 7% | 84% |
8.4 times less than Beef broiled
|
| Sugar | 16g | N/A | 41% |
Equal to Coca-Cola
|
| Fiber | 5.4g | 22% | 27% |
1.3 times more than Orange
|
| Copper | 0.23mg | 26% | 42% |
1.1 times less than Shiitake
|
| Zinc | 0.25mg | 2% | 88% |
45.1 times less than Beef broiled
|
| Starch | 0g | 0% | 100% |
N/A
|
| Phosphorus | 61mg | 9% | 82% |
5.4 times less than Chicken meat
|
| Sodium | 5.4mg | 0% | 94% |
163.3 times less than White Bread
|
| Vitamin A | 157IU | 3% | 44% |
192 times less than Carrot
|
| Vitamin A RAE | 7.2µg | 1% | 59% | |
| Vitamin E | 2.6mg | 18% | 43% |
Equal to Kiwifruit
|
| Manganese | 0.18mg | 8% | 61% | |
| Selenium | 0.36µg | 1% | 94% | |
| Vitamin B1 | 0.05mg | 4% | 84% |
9.9 times less than Pea raw
|
| Vitamin B2 | 0.05mg | 3% | 89% |
5.2 times less than Avocado
|
| Vitamin B3 | 0.61mg | 4% | 83% |
28.1 times less than Turkey meat
|
| Vitamin B5 | 0.33mg | 7% | 82% |
6.2 times less than Sunflower seed
|
| Vitamin B6 | 0.11mg | 9% | 74% |
1.9 times less than Oat
|
| Vitamin B12 | 0µg | 0% | 100% |
N/A
|
| Vitamin K | 73µg | 60% | 44% |
2.5 times less than Broccoli
|
| Trans Fat | 0g | N/A | 100% |
N/A
|
| Folate | 45µg | 11% | 45% |
2.4 times less than Brussels sprout
|
| Choline | 14mg | 3% | 88% | |
| Saturated Fat | 0.05g | 0% | 89% |
203.3 times less than Beef broiled
|
| Monounsaturated Fat | 0.08g | N/A | 85% |
208.5 times less than Avocado
|
| Polyunsaturated fat | 0.52g | N/A | 73% |
164.4 times less than Walnut
|
| Tryptophan | 0.03mg | 0% | 94% |
20.3 times less than Chicken meat
|
| Threonine | 0.08mg | 0% | 94% |
15.3 times less than Beef broiled
|
| Isoleucine | 0.09mg | 0% | 94% |
17.9 times less than Salmon raw
|
| Leucine | 0.12mg | 0% | 95% |
36.8 times less than Tuna Bluefin
|
| Lysine | 0.11mg | 0% | 94% |
7.4 times less than Tofu
|
| Methionine | 0.04mg | 0% | 92% |
4 times less than Quinoa
|
| Phenylalanine | 0.08mg | 0% | 94% |
15.2 times less than Egg
|
| Valine | 0.1mg | 0% | 94% |
35.6 times less than Soybean raw
|
| Histidine | 0.05mg | 0% | 94% |
27.7 times less than Turkey meat
|
| Fructose | 7.8g | 10% | 82% |
1.4 times less than Apple
|
| Omega-3 - EPA | 0g | N/A | 100% |
N/A
|
| Omega-3 - DHA | 0g | N/A | 100% |
N/A
|
| Omega-3 - DPA | 0g | N/A | 100% |
N/A
|
Check out similar food or compare with current
NUTRITION FACTS LABEL
Serving Size ______________
Health checks
Kiwifruit nutrition infographic
References
All the values for which the sources are not specified explicitly are taken from FDA’s Food Central. The exact link to the food presented on this page can be found below.