Marshmallow nutrition: calories, carbs, GI, protein, fiber, fats
Carbs in Marshmallow
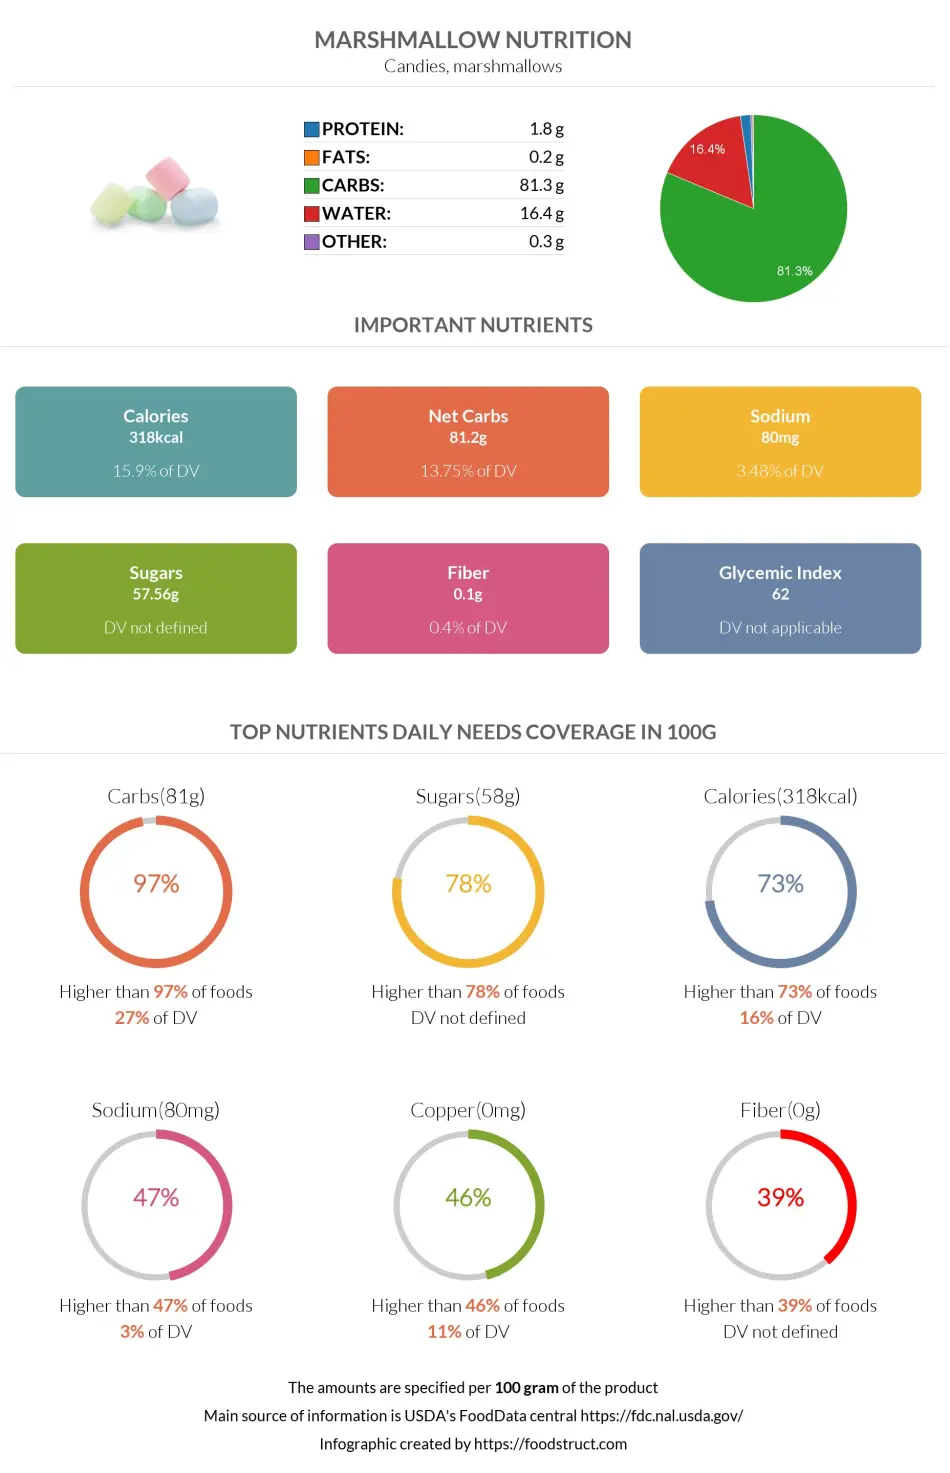
One hundred grams of marshmallows contains 81.3g of carbs, which covers 27% of the daily carb need (in the case of a 2000-calorie diet). Marshmallows are mostly made up of carbs.
Marshmallows should be consumed in moderation.
Compared to all foods in our database, marshmallows are in the top 3% of foods high in carbs and the top 2% of foods high in net carbs.
Macronutrients chart
Carbs per serving size
One regular marshmallow (7.2g) contains 5.85g of carbs.
Ten miniature marshmallows (7g) contain 5.69g of carbs, whereas one cup of ten miniatures (50g) contains 40.6g of carbs.
Marshmallow products
| Carbs per 100g | Carbs per different serving size | |
| Chocolate marshmallow fudge | 71.3 | One piece (20g) - 14.3g |
| Chocolate marshmallow fudge with nuts | 67.7 | One oz - 19.2g |
| Chocolate-coated marshmallow cookie | 67.7g | One small cookie (13g) - 8.8g |
| Marshmallow cream | 79g | One oz - 22.4g |
Marshmallow net carbs
Almost 99.9% of marshmallow carbs are net carbs: 57.56g sugar, 23.64g other net carbs, and 0.1g dietary fiber.
Fiber content ratio for Marshmallow

Top nutrition facts for Marshmallow
| Calories ⓘ Calories for selected serving | 318 kcal |
|
Glycemic index ⓘ
Source:
Check out our Glycemic index chart page for the full list.
|
62 (medium) |
| Glycemic load ⓘ Glycemic Load (GL) is a metric that measures both the quality (Glycemic Index) and quantity of carbohydrates in a specific serving of food to estimate its impact on blood sugar levels. It is calculated as: (GI × Carbs in grams) / 100. | 4 (low) |
| Net carbs ⓘ Net Carbs = Total Carbohydrates – Fiber – Sugar Alcohols | 81 g |
| Default serving size ⓘ Serving sizes are mostly taken from FDA's Reference Amounts Customarily Consumed (RACCs) | 1 regular (7.2 g) |
| Acidity (Based on PRAL) ⓘ PRAL (Potential renal acid load) is calculated using a formula. On the PRAL scale the higher the positive value, the more is the acidifying effect on the body. The lower the negative value, the higher the alkalinity of the food. 0 is neutral. | 1 (acidic) |
Marshmallow calories (kcal)
| Calories for different serving sizes of marshmallow | Calories | Weight |
|---|---|---|
| Calories in 100 grams | 318 | |
| Calories in 10 miniatures | 22 | 7 g |
| Calories in 1 regular | 23 | 7.2 g |
| Calories in 1 cup of miniature | 159 | 50 g |
Extra Nutrition facts for Marshmallow
| Weight per 100 calories ⓘ Shows how many grams of this food equal 100 kcal—higher grams mean a larger portion for the same calories. | 31 g |
Marshmallow Glycemic index (GI)
Marshmallow Glycemic load (GL)
Mineral coverage chart
Mineral chart - relative view
Vitamin coverage chart
Vitamin chart - relative view
Protein quality breakdown
Fat type information
All nutrients for Marshmallow per 100g
| Nutrient | Value | DV% | In TOP % of foods | Comparison |
| Vitamin A | 0µg | 0% | 100% | |
| Calories | 318kcal | 16% | 28% |
6.8 times more than Orange
|
| Protein | 1.8g | 4% | 80% |
1.6 times less than Broccoli
|
| Weight per 100 calories | 31g | N/A | 73% | |
| Fats | 0.2g | 0% | 89% |
166.6 times less than Cheese
|
| Vitamin C | 0mg | 0% | 100% |
N/A
|
| Net carbs | 81g | N/A | 3% |
1.5 times more than Chocolate
|
| Carbs | 81g | 27% | 4% |
2.9 times more than Rice
|
| Cholesterol | 0mg | 0% | 100% |
N/A
|
| Vitamin D* | 0 IU | 0% | 100% |
N/A
|
| Vitamin D | 0µg | 0% | 100% |
N/A
|
| Magnesium | 2mg | 0% | 88% |
70 times less than Almonds
|
| Calcium | 3mg | 0% | 92% |
41.7 times less than Milk
|
| Potassium | 5mg | 0% | 93% |
29.4 times less than Cucumber
|
| Iron | 0.23mg | 3% | 87% |
11.3 times less than Beef broiled
|
| Sugar | 58g | N/A | 2% |
6.4 times more than Coca-Cola
|
| Fiber | 0.1g | 0% | 54% |
24 times less than Orange
|
| Copper | 0.1mg | 11% | 40% |
1.5 times less than Shiitake
|
| Zinc | 0.04mg | 0% | 88% |
157.8 times less than Beef broiled
|
| Phosphorus | 8mg | 1% | 88% |
22.8 times less than Chicken meat
|
| Sodium | 80mg | 3% | 53% |
6.1 times less than White bread
|
| Vitamin E | 0mg | 0% | 100% |
N/A
|
| Manganese | 0.01mg | 0% | 69% | |
| Selenium | 1.7µg | 3% | 59% | |
| Vitamin B1 | 0mg | 0% | 89% |
266 times less than Pea raw
|
| Vitamin B2 | 0mg | 0% | 90% |
130 times less than Avocado
|
| Vitamin B3 | 0.08mg | 0% | 86% |
122.7 times less than Turkey meat
|
| Vitamin B5 | 0.01mg | 0% | 72% |
226 times less than Sunflower seeds
|
| Vitamin B6 | 0mg | 0% | 85% |
39.7 times less than Oats
|
| Vitamin B12 | 0µg | 0% | 100% |
N/A
|
| Vitamin K | 0µg | 0% | 100% |
N/A
|
| Folate | 1µg | 0% | 79% |
61 times less than Brussels sprouts
|
| Saturated fat | 0.06g | 0% | 82% |
105.3 times less than Beef broiled
|
| Choline | 0.1mg | 0% | 53% | |
| Monounsaturated fat | 0.08g | N/A | 75% |
122.5 times less than Avocado
|
| Polyunsaturated fat | 0.05g | N/A | 83% |
1003.7 times less than Walnut
|
| Tryptophan | 0mg | 0% | 100% |
N/A
|
| Threonine | 0.04mg | 0% | 54% |
20.6 times less than Beef broiled
|
| Isoleucine | 0.03mg | 0% | 55% |
32.6 times less than Salmon raw
|
| Leucine | 0.07mg | 0% | 54% |
36.8 times less than Tuna Bluefin
|
| Lysine | 0.08mg | 0% | 52% |
5.9 times less than Tofu
|
| Methionine | 0.02mg | 0% | 54% |
6.4 times less than Quinoa
|
| Phenylalanine | 0.04mg | 0% | 54% |
15.9 times less than Egg
|
| Valine | 0.05mg | 0% | 54% |
40.6 times less than Soybean raw
|
| Histidine | 0.02mg | 0% | 55% |
44.1 times less than Turkey meat
|
| Caffeine | 0mg | 0% | 100% | |
| Omega-3 - EPA | 0g | N/A | 100% |
N/A
|
| Omega-3 - DHA | 0g | N/A | 100% |
N/A
|
| Omega-3 - DPA | 0g | N/A | 100% |
N/A
|
Check out similar food or compare with current
NUTRITION FACTS LABEL
Serving Size ______________
Health checks
Marshmallow nutrition infographic
References
All the values for which the sources are not specified explicitly are taken from FDA’s Food Central. The exact link to the food presented on this page can be found below.