Whiting vs. Tilapia — Health Impact and Nutrition Comparison


Summary
Tilapia is higher in protein, fat, vitamin D, and selenium. Whiting fish contains 27mg more cholesterol, vitamin A, and fewer calories. Tilapia is 76mg lower in sodium. Whiting fish is richer in vitamin B12 and folate.
Introduction
Tilapia and whiting are two of the world's most consumed and widespread fish species. In this article, we will compare these foods, focusing on their nutritional content and health impact and showing their actual differences.
Actual differences
Tilapia is a freshwater fish from the Cichlidae family. The Nile River and the Middle East often have large populations of these fish. The flavor of tilapia is sweet, fishy, and mild. Various cooking techniques are available for tilapia, typically in sealed, poached, steamed, grilled, raw, baked, or smoked forms. Tilapia is widely available in markets in both fresh and frozen forms. Tilapia is classified as white fish along with pollock, cod, swordfish, halibut, haddock, catfish, king mackerel, etc.
Whiting (Merlangius merlangus), or the Atlantic whiting, is a silver saltwater fish primarily found in the Atlantic Ocean.
Whiting fish has a mild, slightly sweeter taste compared to tilapia. It is usually fried with spices. Whiting fish is sold and found worldwide. It is cheaper and more affordable than tilapia.
Nutrition
This section will discuss cooked and dried tilapia and whiting fish's macronutrient, mineral, and vitamin composition. Both of them do not contain any amounts of carbs.
Macronutrient Comparison
Contains
more
OtherOther
+∞%
Contains
more
ProteinProtein
+11.4%
Contains
more
FatsFats
+56.8%
Protein
Tilapia is a good source of protein. Per 100g serving, tilapia provides 26.2g of protein, while whiting contains 23.5g of it.
Both contain many essential amino acids, such as lysine, phenylalanine, and histidine.
Fat
Tilapia is higher in fats than whiting fish. Tilapia is also richer in both saturated and unsaturated fats, being an excellent source of omega-6 fatty acids. Surprisingly, whiting fish is 27mg higher in cholesterol than tilapia.
Fat Type Comparison
Contains
less
Sat. FatSaturated fat
-57.4%
Contains
more
Mono. FatMonounsaturated fat
+114.6%
Calories
Tilapia and whiting fish are classified as low-calorie foods. However, tilapia provides more calories than whiting due to its higher protein and fat composition. It has 12 more calories per 100g serving.
Minerals
Whiting fish provides more calcium, phosphorus, potassium, and zinc than tilapia. Tilapia contains more iron, magnesium, and copper. Tilapia is 76g lower in sodium than whiting. Whiting fish is comparably richer in mercury, while tilapia provides more selenium (1).
See the mineral comparison chart to learn more about mineral distribution in these species.
Mineral Comparison
Contains
more
CalciumCalcium
+342.9%
Contains
more
PotassiumPotassium
+14.2%
Contains
more
ZincZinc
+29.3%
Contains
more
PhosphorusPhosphorus
+39.7%
Contains
more
ManganeseManganese
+251.4%
Contains
more
MagnesiumMagnesium
+25.9%
Contains
more
IronIron
+64.3%
Contains
more
CopperCopper
+87.5%
Contains
less
SodiumSodium
-57.6%
Contains
more
SeleniumSelenium
+32.4%
Vitamins
In general, tilapia has a higher vitamin content. It is richer in vitamins E, K, D, and B-complex vitamins.
Whiting fish contains vitamin A, which is not present in tilapia. It is also higher in folate and vitamin B12.
Vitamin Comparison
Contains
more
Vitamin AVitamin A
+∞%
Contains
more
Vitamin B6Vitamin B6
+46.3%
Contains
more
Vitamin B12Vitamin B12
+39.8%
Contains
more
FolateFolate
+150%
Contains
more
Vitamin DVitamin D
+105.6%
Contains
more
Vitamin EVitamin E
+107.9%
Contains
more
Vitamin B1Vitamin B1
+36.8%
Contains
more
Vitamin B2Vitamin B2
+21.7%
Contains
more
Vitamin B3Vitamin B3
+184.1%
Contains
more
Vitamin B5Vitamin B5
+165.6%
Contains
more
Vitamin KVitamin K
+800%
Health impact
Cardiovascular health
Using fish such as tilapia and whiting lowers the risk of heart disease (2). This is due to the high content of omega-3 and omega-6 fatty acid found in these foods. Omega-3 and omega-6 are long-chain essential fatty acids, meaning we can obtain them by consuming different foods. So, we must acquire them through the food we consume. According to research, blood flow that is out of balance in terms of omega-6 to omega-3 fatty acid ratio can higher the risk of cardiovascular disease (3).
Health risks
Whiting fish is classified as a food with moderate mercury content. This mineral can be dangerous to toddlers, teenagers, and pregnant women even though it is safe for healthy middle-aged people (4). You should eat less fish to reduce the risk of mercury poisoning.
You should be aware that tilapia is frequently farmed using toxic chemicals and banned methods and frequently fed animal waste as food. It might include dioxin, which is a potential carcinogen (5).
References

Infographic
All nutrients comparison - raw data values
| Nutrient | |
|
DV% diff. |
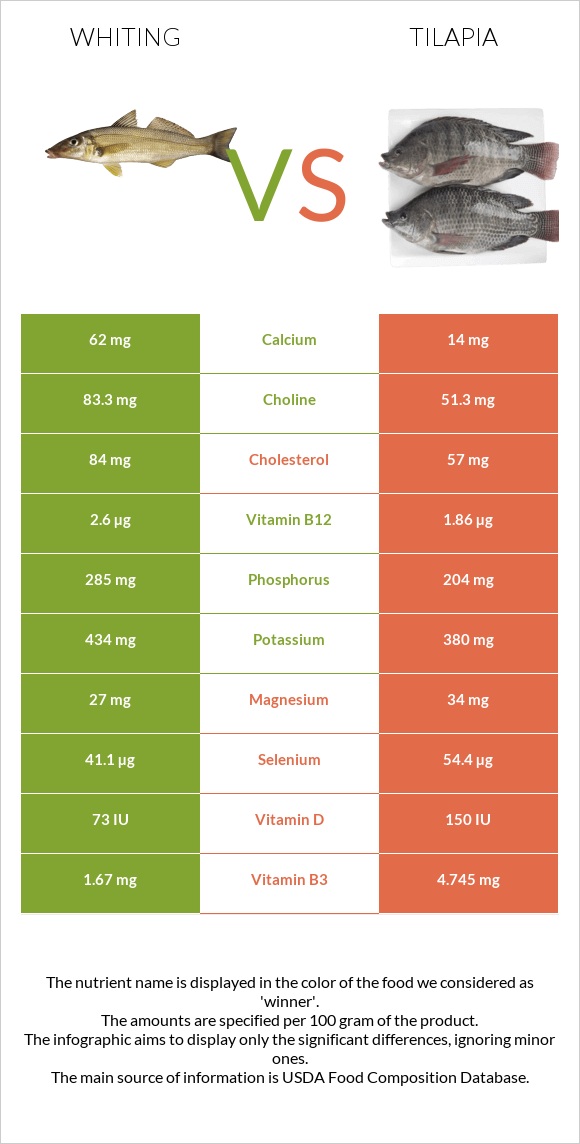
| Vitamin B12 | 2.6µg | 1.86µg | 31% |
| Selenium | 41.1µg | 54.4µg | 24% |
| Vitamin B3 | 1.67mg | 4.745mg | 19% |
| Phosphorus | 285mg | 204mg | 12% |
| Vitamin D* | 73 IU | 150 IU | 10% |
| Vitamin D | 1.8µg | 3.7µg | 10% |
| Cholesterol | 84mg | 57mg | 9% |
| Vitamin B5 | 0.25mg | 0.664mg | 8% |
| Choline | 83.3mg | 51.3mg | 6% |
| Protein | 23.48g | 26.15g | 5% |
| Calcium | 62mg | 14mg | 5% |
| Copper | 0.04mg | 0.075mg | 4% |
| Vitamin A | 38µg | 0µg | 4% |
| Manganese | 0.13mg | 0.037mg | 4% |
| Vitamin B6 | 0.18mg | 0.123mg | 4% |
| Iron | 0.42mg | 0.69mg | 3% |
| Sodium | 132mg | 56mg | 3% |
| Vitamin E | 0.38mg | 0.79mg | 3% |
| Magnesium | 27mg | 34mg | 2% |
| Potassium | 434mg | 380mg | 2% |
| Vitamin B1 | 0.068mg | 0.093mg | 2% |
| Folate | 15µg | 6µg | 2% |
| Saturated fat | 0.4g | 0.94g | 2% |
| Calories | 116kcal | 128kcal | 1% |
| Fats | 1.69g | 2.65g | 1% |
| Zinc | 0.53mg | 0.41mg | 1% |
| Vitamin B2 | 0.06mg | 0.073mg | 1% |
| Vitamin K | 0.1µg | 0.9µg | 1% |
| Monounsaturated fat | 0.445g | 0.955g | 1% |
| Protein per 100 calories | 20g | 20g | N/A |
| Calories per 10 g protein | 49kcal | 49kcal | N/A |
| Weight per 100 calories | 86g | 78g | N/A |
| Unsaturated / Saturated Fat ratio | 2.6 | 1.7 | N/A |
| Polyunsaturated fat | 0.587g | 0.6g | 0% |
| Tryptophan | 0.263mg | 0.265mg | 0% |
| Threonine | 1.029mg | 1.156mg | 0% |
| Isoleucine | 1.082mg | 1.22mg | 0% |
| Leucine | 1.908mg | 2.04mg | 0% |
| Lysine | 2.156mg | 2.315mg | 0% |
| Methionine | 0.695mg | 0.766mg | 0% |
| Phenylalanine | 0.917mg | 1.05mg | 0% |
| Valine | 1.21mg | 1.28mg | 0% |
| Histidine | 0.691mg | 0.585mg | 0% |
| Omega-3 - EPA | 0.283g | 0.005g | N/A |
| Omega-3 - DHA | 0.235g | 0.13g | N/A |
| Omega-3 - ALA | 0.045g | N/A | |
| Omega-3 - DPA | 0.017g | 0.06g | N/A |
| Omega-6 - Eicosadienoic acid | 0.015g | N/A |
People also compare


References
All the values for which the sources are not specified explicitly are taken from FDA’s Food Central. The exact link to the food presented on this page can be found below.
- Whiting - https://fdc.nal.usda.gov/fdc-app.html#/food-details/175161/nutrients
- Tilapia - https://fdc.nal.usda.gov/fdc-app.html#/food-details/175177/nutrients
All the Daily Values are presented for males aged 31-50, for 2000-calorie diets.