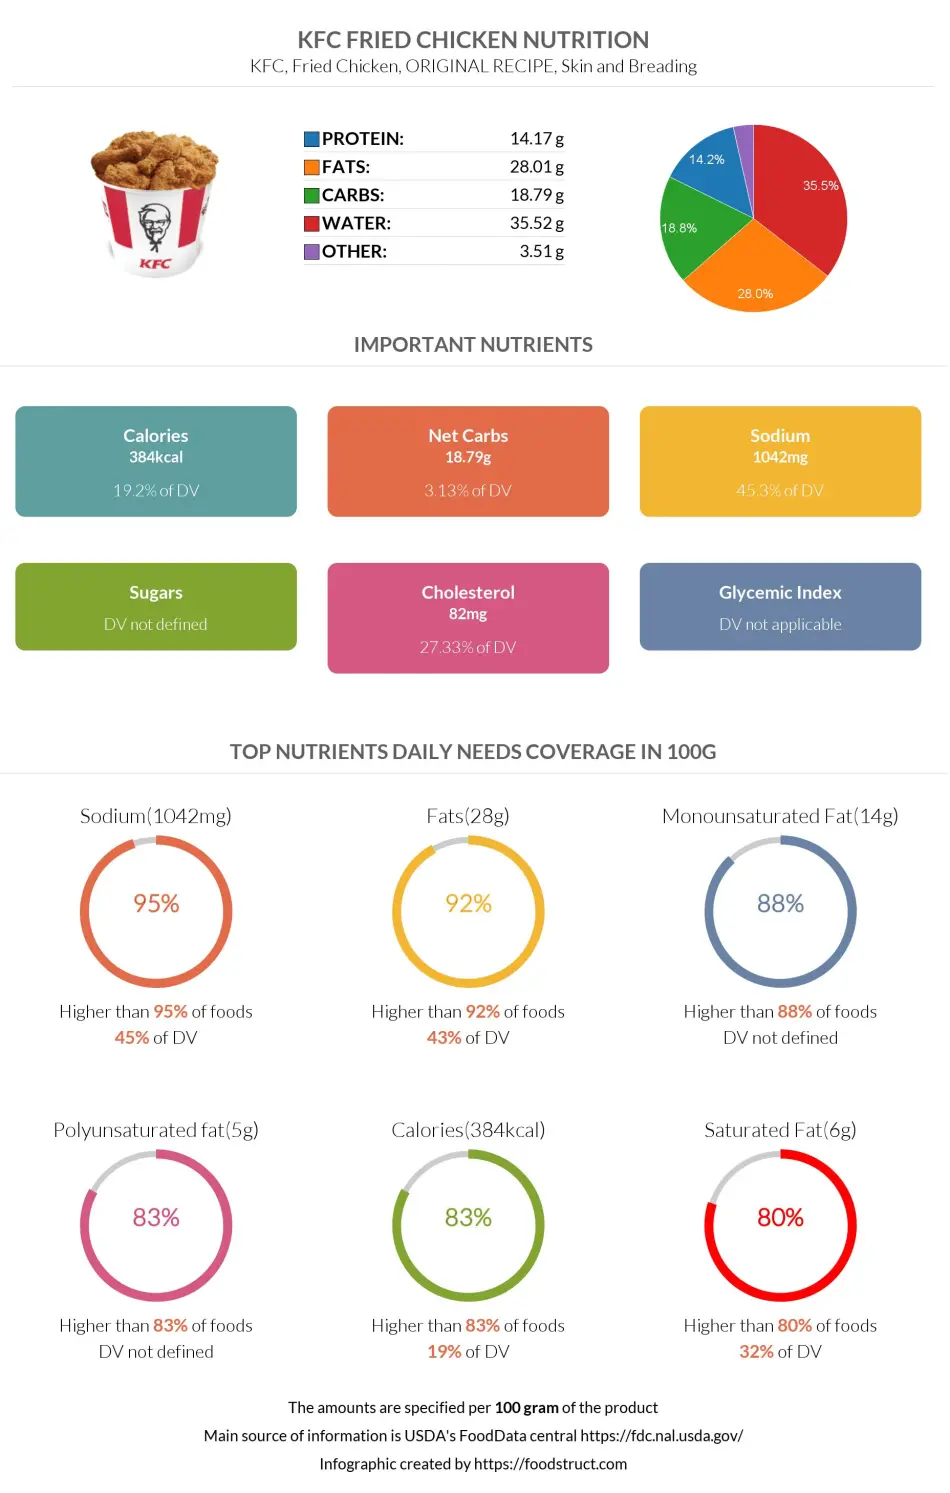
KFC Fried Chicken nutrition: calories, carbs, GI, protein, fiber, fats
KFC, Fried Chicken, ORIGINAL RECIPE, Skin and Breading
*all the values are displayed for the amount of 100 grams
Top nutrition facts for KFC Fried Chicken

| Calories ⓘ Calories for selected serving | 384 kcal |
| Fats | 28.01 g |
| Cholesterol | 82 mg |
| Sodium | 1042 mg |
| Net carbs ⓘ Net Carbs = Total Carbohydrates – Fiber – Sugar Alcohols | 19 g |
Monounsaturated fat ⓘHigher in Monounsaturated fat content than 95% of foods
Sodium ⓘHigher in Sodium content than 95% of foods
Fats ⓘHigher in Fats content than 92% of foods
Polyunsaturated fat ⓘHigher in Polyunsaturated fat content than 90% of foods
Vitamin E ⓘHigher in Vitamin E content than 88% of foods
KFC Fried Chicken calories (kcal)
| Calories for different serving sizes of kFC Fried Chicken | Calories | Weight |
|---|---|---|
| Calories in 100 grams | 384 |
| Calories for different varieties of kFC Fried Chicken | Calories | Weight |
|---|---|---|
| KFC, Fried Chicken, ORIGINAL RECIPE, Skin and Breading (this food) | 384 | 100 g |
| KFC, Fried Chicken, ORIGINAL RECIPE, Breast, meat only, skin and breading removed | 149 | 100 g |
| KFC, Fried Chicken, ORIGINAL RECIPE, Drumstick, meat only, skin and breading removed | 175 | 100 g |
| KFC, Fried Chicken, ORIGINAL RECIPE, Thigh, meat only, skin and breading removed | 175 | 100 g |
| KFC, Fried Chicken, ORIGINAL RECIPE, Wing, meat only, skin and breading removed | 216 | 100 g |
| KFC, Fried Chicken, ORIGINAL RECIPE, Breast, meat and skin with breading | 231 | 100 g |
| KFC, Fried Chicken, EXTRA CRISPY, Wing, meat only, skin and breading removed | 236 | 100 g |
| KFC, Fried Chicken, ORIGINAL RECIPE, Drumstick, meat and skin with breading | 239 | 100 g |
| KFC, Fried Chicken, ORIGINAL RECIPE, Thigh, meat and skin with breading | 269 | 100 g |
| KFC, Fried Chicken, ORIGINAL RECIPE, Wing, meat and skin with breading | 297 | 100 g |
| KFC, Popcorn Chicken | 351 | 100 g |
Extra Nutrition facts for KFC Fried Chicken
| Protein per 100 calories ⓘ Shows how many grams of protein you get from 100 calories of this food, calculated as (protein in g ÷ calories) × 100. | 3.7 g |
| Calories per 10 g protein ⓘ Shows how many calories you need to eat from this food to get 10 g of protein, calculated as (calories ÷ protein in g) × 10. | 271 kcal |
| Weight per 100 calories ⓘ Shows how many grams of this food equal 100 kcal—higher grams mean a larger portion for the same calories. | 26 g |
| Unsaturated / Saturated Fat ratio ⓘ (monounsaturated + polyunsaturated) / saturated, ≥2 broadly recommended by major guidelines for heart health | 3.1 |
Mineral coverage chart
Mineral chart - relative view
Vitamin coverage chart
Vitamin A:
60µg of 900µg
6.7%
Vitamin E:
3.6mg of 15mg
24%
Vitamin D:
0µg of 20µg
0%
Vitamin C:
0mg of 90mg
0%
Vitamin B1:
0.24mg of 1mg
20%
Vitamin B2:
0.59mg of 1mg
45%
Vitamin B3:
16mg of 16mg
102%
Vitamin B5:
2.6mg of 5mg
53%
Vitamin B6:
0.42mg of 1mg
32%
Folate:
0µg of 400µg
0%
Vitamin B12:
0.96µg of 2µg
40%
Vitamin K:
0µg of 120µg
0%
Vitamin chart - relative view
Macronutrients chart
Protein:
Daily Value: 28%
14.2 g of 50 g
14.2 g (28% of DV )
Fats:
Daily Value: 43%
28 g of 65 g
28 g (43% of DV )
Carbs:
Daily Value: 6%
18.8 g of 300 g
18.8 g (6% of DV )
Water:
Daily Value: 2%
35.5 g of 2,000 g
35.5 g (2% of DV )
Other:
3.5 g
3.5 g
Protein quality breakdown
Tryptophan:
324mg of 280mg
116%
Threonine:
1401mg of 1,050mg
133%
Isoleucine:
1248mg of 1,400mg
89%
Leucine:
2592mg of 2,730mg
95%
Lysine:
1845mg of 2,100mg
88%
Methionine:
615mg of 1,050mg
59%
Phenylalanine:
1626mg of 1,750mg
93%
Valine:
1548mg of 1,820mg
85%
Histidine:
1011mg of 700mg
144%
Fat type information
Saturated fat:
6.3 g
Monounsaturated fat:
14 g
Polyunsaturated fat:
5.4 g
Carbohydrate type breakdown
Starch:
17 g
Sucrose:
0 g
Glucose:
0 g
Fructose:
0 g
Lactose:
0 g
Maltose:
0 g
Galactose:
0 g
All nutrients for KFC Fried Chicken per 100g
| Nutrient | Value | DV% | In TOP % of foods | Comparison |
| Vitamin A | 20µg | 2% | 26% | |
| Calories | 384kcal | 19% | 17% |
8.2 times more than Orange
|
| Protein | 14g | 34% | 36% |
5 times more than Broccoli
|
| Protein per 100 calories | 3.7g | N/A | 54% | |
| Calories per 10 g protein | 271kcal | N/A | 43% | |
| Weight per 100 calories | 26g | N/A | 83% | |
| Fats | 28g | 43% | 8% |
1.2 times less than Cheese
|
| Unsaturated / Saturated Fat ratio | 3.1 | N/A | 25% | |
| Net carbs | 19g | N/A | 34% |
2.9 times less than Chocolate
|
| Carbs | 19g | 6% | 37% |
1.5 times less than Rice
|
| Cholesterol | 82mg | 27% | 16% |
4.5 times less than Egg
|
| Magnesium | 25mg | 6% | 35% |
5.6 times less than Almonds
|
| Calcium | 117mg | 12% | 16% |
1.1 times less than Milk
|
| Potassium | 244mg | 7% | 45% |
1.7 times more than Cucumber
|
| Iron | 0.88mg | 11% | 63% |
3 times less than Beef broiled
|
| Sugar | 0g | N/A | 100% |
N/A
|
| Fiber | 0g | 0% | 100% |
N/A
|
| Copper | 0.08mg | 9% | 48% |
1.7 times less than Shiitake
|
| Zinc | 0.87mg | 8% | 49% |
7.3 times less than Beef broiled
|
| Starch | 17g | 7% | 6% |
1.1 times more than Potato
|
| Phosphorus | 252mg | 36% | 16% |
1.4 times more than Chicken meat
|
| Sodium | 1042mg | 45% | 5% |
2.1 times more than White bread
|
| Vitamin E | 1.2mg | 8% | 12% |
1.2 times less than Kiwi
|
| Manganese | 0.3mg | 13% | 21% | |
| Selenium | 17µg | 31% | 31% | |
| Vitamin B1 | 0.08mg | 7% | 50% |
3.3 times less than Pea raw
|
| Vitamin B2 | 0.2mg | 15% | 40% |
1.5 times more than Avocado
|
| Vitamin B3 | 5.4mg | 34% | 23% |
1.8 times less than Turkey meat
|
| Vitamin B5 | 0.88mg | 18% | 13% |
1.3 times less than Sunflower seeds
|
| Vitamin B6 | 0.14mg | 11% | 47% |
1.2 times more than Oats
|
| Vitamin B12 | 0.32µg | 13% | 41% |
2.2 times less than Pork
|
| Trans fat | 0.21g | N/A | 13% |
69.6 times less than Margarine
|
| Saturated fat | 6.3g | 32% | 16% |
1.1 times more than Beef broiled
|
| Monounsaturated fat | 14g | N/A | 5% |
1.5 times more than Avocado
|
| Polyunsaturated fat | 5.4g | N/A | 10% |
8.8 times less than Walnut
|
| Tryptophan | 0.11mg | 0% | 36% |
2.8 times less than Chicken meat
|
| Threonine | 0.47mg | 0% | 33% |
1.5 times less than Beef broiled
|
| Isoleucine | 0.42mg | 0% | 35% |
2.2 times less than Salmon raw
|
| Leucine | 0.86mg | 0% | 34% |
2.8 times less than Tuna Bluefin
|
| Lysine | 0.62mg | 0% | 34% |
1.4 times more than Tofu
|
| Methionine | 0.21mg | 0% | 34% |
2.1 times more than Quinoa
|
| Phenylalanine | 0.54mg | 0% | 33% |
1.2 times less than Egg
|
| Valine | 0.52mg | 0% | 35% |
3.9 times less than Soybean raw
|
| Histidine | 0.34mg | 0% | 32% |
2.2 times less than Turkey meat
|
| Fructose | 0g | 0% | 100% |
N/A
|
| Omega-3 - EPA | 0g | N/A | 17% |
345 times less than Salmon
|
| Omega-3 - DHA | 0g | N/A | 13% |
486.7 times less than Salmon
|
| Omega-3 - ALA | 0.76g | N/A | 2% |
12 times less than Canola oil
|
| Omega-3 - DPA | 0.01g | N/A | 16% |
28.3 times less than Salmon
|
| Omega-3 - Eicosatrienoic acid | 0g | N/A | 4% | |
| Omega-6 - Gamma-linoleic acid | 0.05g | N/A | 1% | |
| Omega-6 - Dihomo-gamma-linoleic acid | 0.03g | N/A | 1% | |
| Omega-6 - Eicosadienoic acid | 0.02g | N/A | 4% | |
| Omega-6 - Linoleic acid | 4.3g | N/A | 3% |
2.8 times less than Almonds
|
Check out similar food or compare with current
NUTRITION FACTS LABEL
Nutrition Facts
___servings per container
Serving Size ______________
Serving Size ______________
Amount Per 100g
Calories 384
% Daily Value*
43%
Total Fat
28g
29%
Saturated Fat 6.3g
0
Trans Fat
0g
27%
Cholesterol 82mg
45%
Sodium 1042mg
6.3%
Total Carbohydrate
19g
0
Dietary Fiber
0g
Total Sugars 0g
Includes ? g Added Sugars
Protein
14g
Vitamin D
0mcg
0
Calcium
117mg
12%
Iron
0.88mg
11%
Potassium
244mg
7.2%
*
The % Daily Value (DV) tells you how much a nutrient in a serving of food contributes to a daily diet. 2,000 calories a day is used for general nutrition advice.
Health checks
ⓘ
Dietary cholesterol is not associated with an increased risk of coronary heart disease in healthy individuals. However, dietary cholesterol is common in foods that are high in harmful saturated fats.
Source
Low in Cholesterol
ⓘ
Trans fat consumption increases the risk of cardiovascular disease and mortality by negatively affecting blood lipid levels.
Source
No Trans Fats
ⓘ
Saturated fat intake can raise total cholesterol and LDL (low-density lipoprotein) levels, leading to an increased risk of atherosclerosis. Dietary guidelines recommend limiting saturated fats to under 10% of calories a day.
Source
Low in Saturated Fats
ⓘ
While the consumption of moderate amounts of added sugars is not detrimental to health, an excessive intake can increase the risk of obesity, and therefore, diabetes.
Source
Low in Sugars
KFC Fried Chicken nutrition infographic
Infographic link
References
All the values for which the sources are not specified explicitly are taken from FDA’s Food Central. The exact link to the food presented on this page can be found below.