Potato bread nutrition: calories, carbs, GI, protein, fiber, fats
Carbs in Potato Bread
Carbs are the primary component of potato bread, making up nearly 47% of its composition. The carbohydrate content covers nearly 16% of the daily recommended value for carbohydrates.
Per 100g of potato bread, there are 47g of total carbohydrates.
Below is the chart that displays the macronutrient distribution.
Macronutrients chart
Carbs per serving size
One slice of potato bread is the serving size equivalent to 32g. In a serving size of potato bread, we have 15g of total carbohydrates.
In addition, the net carbs content in 1 serving is 13g.
Carbs of different types
The amount of carbohydrates present in different varieties of potato bread can vary depending on the specific ingredients used and the methods applied during the cooking process.
| Carbs per 100g | |
| Potato bread | 47g |
| Potato and Rice Flour Infused White Gluten-Free Bread | 52.8g |
Net carbs in potato bread
The net carbs equal 40.77g per 100g of potato bread. This means that this food is high in carbohydrates, and potato bread should not be eaten when undergoing low-carb diets.
Fiber distribution in potato bread
Potato bread contains 6.3g of fiber in 100g. In turn, this translates into 2g of fiber per serving. On average, they cover 6% of the daily recommended value of fiber intake per serving, considering 30g of fiber/day.
Fiber content ratio for Potato bread
Comparison to other foods
Potato bread's carbohydrate content can be compared to similar foods in its category, as listed in the table below.
| Food | Carbohydrates (per serving) | Carbohydrates per 100g |
| Potato bread | 15g (32g) | 47g |
| Rye bread | 27.4g (57g) | 48g |
| Cornbread | 19.46g (28g) | 69.5g |
| Multigrain bread | 20.2g (43g) | 47g |
| Oat bread | 11.2g (28g) | 40g |
| French bread | 27.9g (45g) | 62g |
| White bread | 10.6g (25g) | 42.4g |

Top nutrition facts for Potato bread
| Calories ⓘ Calories for selected serving | 266 kcal |
|
Glycemic index ⓘ
Source: The GI for the potato-wheat bread https://pubmed.ncbi.nlm.nih.gov/27608859
Potato flour lowers the GI of wheat bread https://www.sciencedirect.com/science/article/pii/S2095311916613886
Check out our Glycemic index chart page for the full list.
|
61 (medium) |
| Glycemic load ⓘ Glycemic Load (GL) is a metric that measures both the quality (Glycemic Index) and quantity of carbohydrates in a specific serving of food to estimate its impact on blood sugar levels. It is calculated as: (GI × Carbs in grams) / 100. | 8 (low) |
| Net carbs ⓘ Net Carbs = Total Carbohydrates – Fiber – Sugar Alcohols | 41 g |
| Default serving size ⓘ Serving sizes are mostly taken from FDA's Reference Amounts Customarily Consumed (RACCs) | 1 slice (32 g) |
| Acidity (Based on PRAL) ⓘ PRAL (Potential renal acid load) is calculated using a formula. On the PRAL scale the higher the positive value, the more is the acidifying effect on the body. The lower the negative value, the higher the alkalinity of the food. 0 is neutral. | 1.5 (acidic) |
Potato bread calories (kcal)
| Calories for different serving sizes of potato bread | Calories | Weight |
|---|---|---|
| Calories in 100 grams | 266 | |
| Calories in 1 slice | 85 | 32 g |
Extra Nutrition facts for Potato bread
| Protein per 100 calories ⓘ Shows how many grams of protein you get from 100 calories of this food, calculated as (protein in g ÷ calories) × 100. | 4.7 g |
| Calories per 10 g protein ⓘ Shows how many calories you need to eat from this food to get 10 g of protein, calculated as (calories ÷ protein in g) × 10. | 213 kcal |
| Weight per 100 calories ⓘ Shows how many grams of this food equal 100 kcal—higher grams mean a larger portion for the same calories. | 38 g |
Potato bread Glycemic index (GI)
Potato bread Glycemic load (GL)
Mineral coverage chart
Mineral chart - relative view
Vitamin coverage chart
Vitamin chart - relative view
Protein quality breakdown
All nutrients for Potato bread per 100g
| Nutrient | Value | DV% | In TOP % of foods | Comparison |
| Vitamin A | 24µg | 3% | 24% | |
| Calories | 266kcal | 13% | 36% |
5.7 times more than Orange
|
| Protein per 100 calories | 4.7g | N/A | 47% | |
| Weight per 100 calories | 38g | N/A | 65% | |
| Protein | 13g | 30% | 39% |
4.4 times more than Broccoli
|
| Calories per 10 g protein | 213kcal | N/A | 50% | |
| Fats | 3.1g | 5% | 62% |
10.6 times less than Cheese
|
| Vitamin C | 0mg | 0% | 100% |
N/A
|
| Carbs | 47g | 16% | 22% |
1.7 times more than Rice
|
| Net carbs | 41g | N/A | 23% |
1.3 times less than Chocolate
|
| Cholesterol | 0mg | 0% | 100% |
N/A
|
| Vitamin D | 0.1µg | 1% | 24% |
22 times less than Egg
|
| Vitamin D* | 2 IU | 0% | 25% |
43.5 times less than Egg
|
| Magnesium | 28mg | 7% | 27% |
5 times less than Almonds
|
| Calcium | 188mg | 19% | 9% |
1.5 times more than Milk
|
| Potassium | 718mg | 21% | 4% |
4.9 times more than Cucumber
|
| Iron | 2.3mg | 28% | 32% |
1.2 times less than Beef broiled
|
| Sugar | 9.4g | N/A | 20% |
Equal to Coca-Cola
|
| Fiber | 6.3g | 25% | 9% |
2.6 times more than Orange
|
| Copper | 0.09mg | 10% | 42% |
1.5 times less than Shiitake
|
| Zinc | 1.4mg | 13% | 39% |
4.4 times less than Beef broiled
|
| Phosphorus | 369mg | 53% | 6% |
2 times more than Chicken meat
|
| Sodium | 375mg | 16% | 28% |
1.3 times less than White bread
|
| Vitamin E | 0.47mg | 3% | 25% |
3.1 times less than Kiwi
|
| Manganese | 0.25mg | 11% | 24% | |
| Selenium | 9.5µg | 17% | 42% | |
| Vitamin B1 | 0.19mg | 16% | 29% |
1.4 times less than Pea raw
|
| Vitamin B2 | 0.11mg | 8% | 60% |
1.2 times less than Avocado
|
| Vitamin B3 | 1.3mg | 8% | 59% |
7.7 times less than Turkey meat
|
| Vitamin B5 | 0.82mg | 16% | 16% |
1.4 times less than Sunflower seeds
|
| Vitamin B6 | 0.23mg | 18% | 36% |
1.9 times more than Oats
|
| Vitamin B12 | 0.15µg | 6% | 47% |
4.7 times less than Pork
|
| Vitamin K | 6.8µg | 6% | 13% |
14.9 times less than Broccoli
|
| Trans fat | 0g | N/A | 100% |
N/A
|
| Folate | 126µg | 32% | 8% |
2.1 times more than Brussels sprouts
|
| Choline | 18mg | 3% | 31% | |
| Saturated fat | 0g | 0% | 100% |
N/A
|
| Monounsaturated fat | 0g | N/A | 100% |
N/A
|
| Polyunsaturated fat | 0g | N/A | 100% |
N/A
|
| Tryptophan | 0.08mg | 0% | 40% |
3.8 times less than Chicken meat
|
| Threonine | 0.22mg | 0% | 41% |
3.2 times less than Beef broiled
|
| Isoleucine | 0.27mg | 0% | 41% |
3.4 times less than Salmon raw
|
| Leucine | 0.44mg | 0% | 42% |
5.5 times less than Tuna Bluefin
|
| Lysine | 0.31mg | 0% | 40% |
1.5 times less than Tofu
|
| Methionine | 0.11mg | 0% | 41% |
1.2 times more than Quinoa
|
| Phenylalanine | 0.29mg | 0% | 42% |
2.3 times less than Egg
|
| Valine | 0.31mg | 0% | 42% |
6.7 times less than Soybean raw
|
| Histidine | 0.14mg | 0% | 42% |
5.2 times less than Turkey meat
|
| Caffeine | 0mg | 0% | 100% | |
| Omega-3 - EPA | 0g | N/A | 100% |
N/A
|
| Omega-3 - DHA | 0g | N/A | 100% |
N/A
|
| Omega-3 - DPA | 0g | N/A | 100% |
N/A
|
| Omega-6 - Eicosadienoic acid | 0g | N/A | 100% |
Check out similar food or compare with current
NUTRITION FACTS LABEL
Serving Size ______________
Health checks
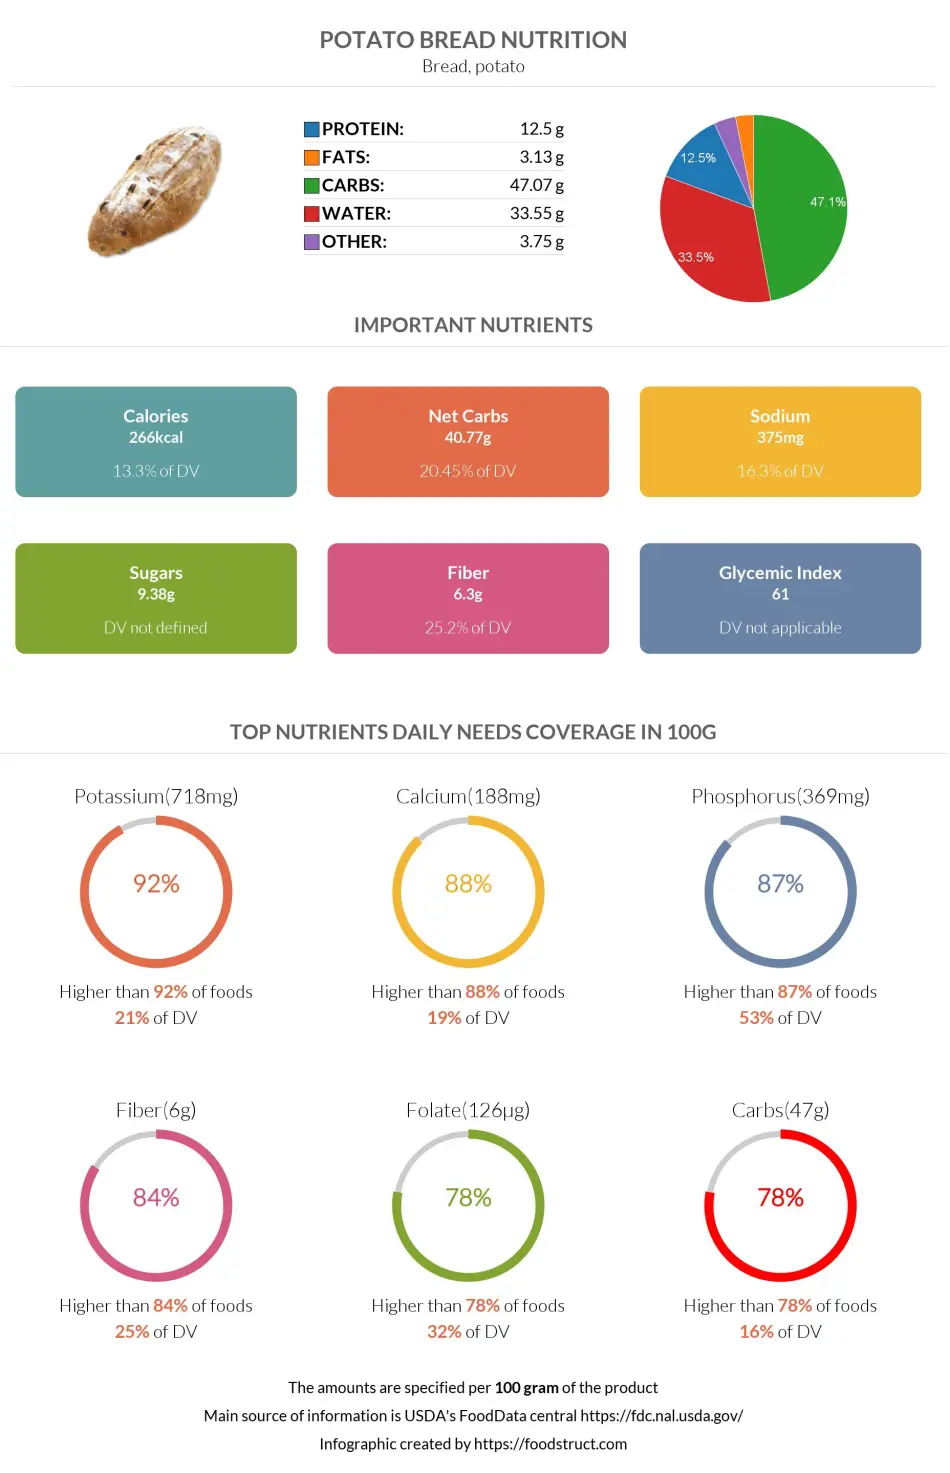
Potato bread nutrition infographic
References
All the values for which the sources are not specified explicitly are taken from FDA’s Food Central. The exact link to the food presented on this page can be found below.