Baked beans nutrition: calories, carbs, GI, protein, fiber, fats
Carbs in Baked Beans
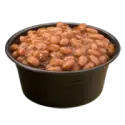
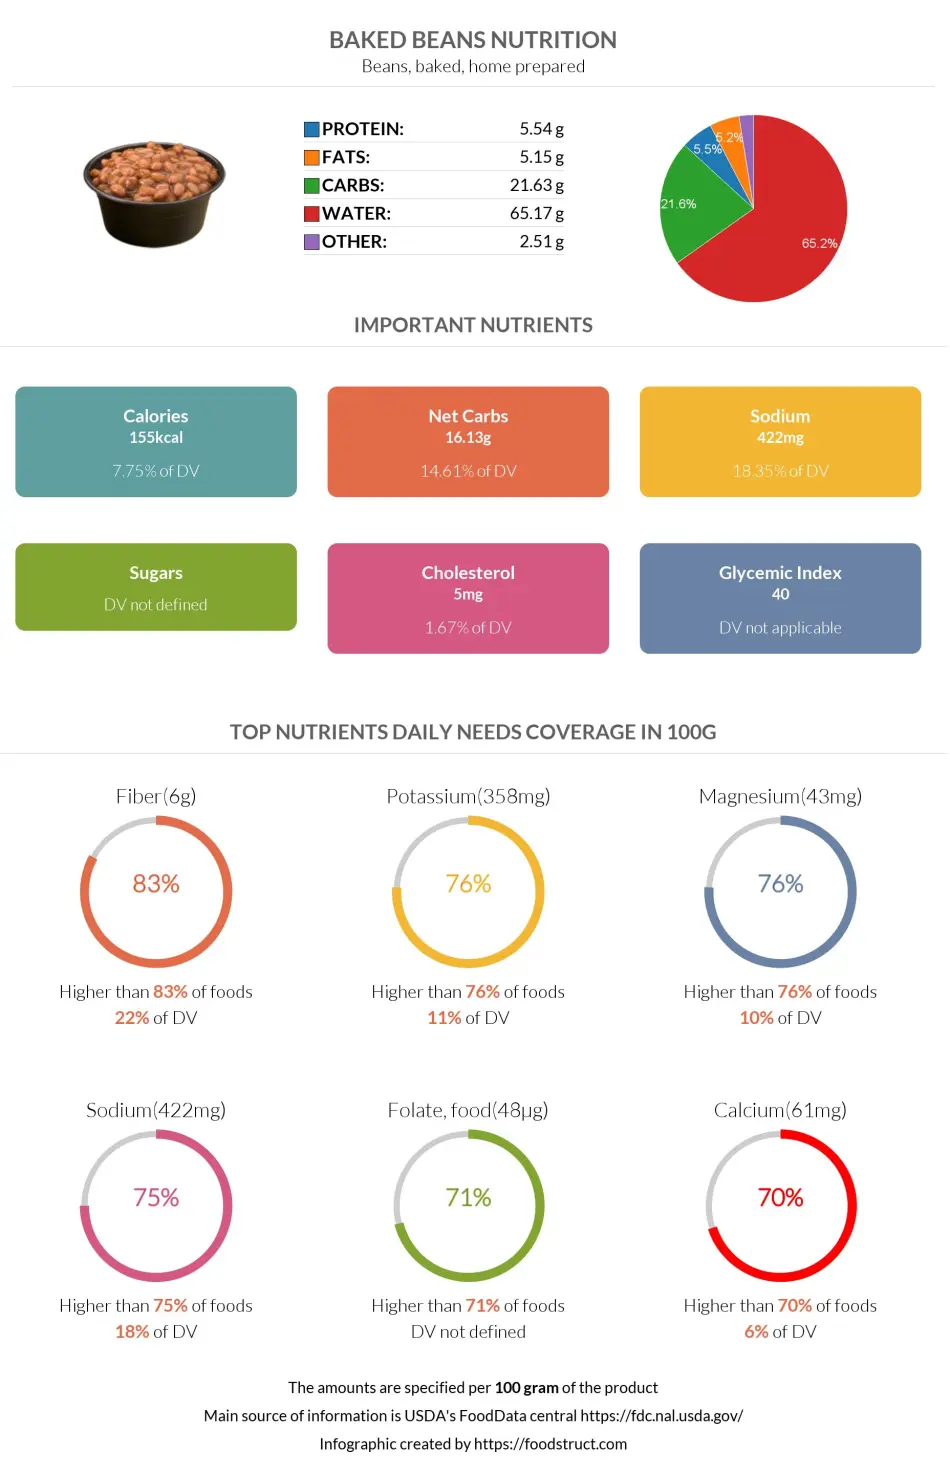
Baked beans primarily contain water, but carbohydrates become their main component if we ignore the water content. 100g of home-prepared baked beans provides 21.6 grams of carbs, equalling 7% of the daily carbohydrate requirements.
Macronutrients chart
Carbs Per Serving Size
Baked beans are usually served in one cup (253 grams).
One cup of baked beans contains 54.6 grams of carbohydrates, and 21g carbs per 100g accordingly.
Baked Beans Net Carbs
5.5 grams of all carbs in baked beans are fibers. Thus, the net carb content of this food equals 16.1g.
This food is processed and provides nearly five times less fiber than usual kidney beans do. Hence, baked beans tend to be higher in net carbs.
Soluble and Insoluble Fiber
According to the research, one cup of baked beans provides 12.7g of dietary fiber, of which 1.79g is soluble (1).
Fiber content ratio for Baked beans
COMPARISON WITH OTHER FOODS
| Food | Carbs per serving | Carbs per 100g | Fiber |
|---|---|---|---|
| Baked beans | 54.6g (253g) | 21.6g | 5.5g |
| Soup beans | 27.2g (243g) | 11.2g | 4.6g |
| Soybean | 56.2g (186g) | 30.2g | 9.3g |
| Kidney beans | 110g (184g) | 60g | 24.9g |
References

Top nutrition facts for Baked beans
| Calories ⓘ Calories for selected serving | 155 kcal |
|
Glycemic index ⓘ
Source:
Check out our Glycemic index chart page for the full list.
|
40 (low) |
| Glycemic load ⓘ Glycemic Load (GL) is a metric that measures both the quality (Glycemic Index) and quantity of carbohydrates in a specific serving of food to estimate its impact on blood sugar levels. It is calculated as: (GI × Carbs in grams) / 100. | 16 (medium) |
| Insulin index ⓘ The insulin index of foods demonstrates how much a food increases the insulin level in the blood, in the first two-hour period after consumption. | 88 ⓘ https://ses.library.usyd.edu.au/handle/2123/11945 – 88 |
| Net carbs ⓘ Net Carbs = Total Carbohydrates – Fiber – Sugar Alcohols | 16 g |
| Default serving size ⓘ Serving sizes are mostly taken from FDA's Reference Amounts Customarily Consumed (RACCs) | 1 cup (253 g) |
| Acidity (Based on PRAL) ⓘ PRAL (Potential renal acid load) is calculated using a formula. On the PRAL scale the higher the positive value, the more is the acidifying effect on the body. The lower the negative value, the higher the alkalinity of the food. 0 is neutral. | -2.7 (alkaline) |
| Oxalates | 1 mg ⓘ https://www.ncbi.nlm.nih.gov/pmc/articles/PMC10599953/ |
Baked beans calories (kcal)
| Calories for different serving sizes of baked beans | Calories | Weight |
|---|---|---|
| Calories in 100 grams | 155 | |
| Calories in 1 cup | 392 | 253 g |
| Calories for different varieties of baked beans | Calories | Weight |
|---|---|---|
| Beans, baked, home prepared (this food) | 155 | 100 g |
| Beans, cranberry (roman), mature seeds, canned | 83 | 100 g |
| Beans, black turtle, mature seeds, canned | 91 | 100 g |
| Beans, black, mature seeds, canned, low sodium | 91 | 100 g |
| Beans, chili, barbecue, ranch style, cooked | 97 | 100 g |
| Beans, black turtle, mature seeds, cooked, boiled, with salt | 130 | 100 g |
| Beans, black, mature seeds, cooked, boiled, without salt | 132 | 100 g |
| Beans, black, mature seeds, cooked, boiled, with salt | 132 | 100 g |
| Beans, cranberry (roman), mature seeds, cooked, boiled, with salt | 136 | 100 g |
| Black turtle bean | 339 | 100 g |
| Beans, black, mature seeds, raw | 341 | 100 g |
Extra Nutrition facts for Baked beans
| Protein per 100 calories ⓘ Shows how many grams of protein you get from 100 calories of this food, calculated as (protein in g ÷ calories) × 100. | 3.6 g |
| Calories per 10 g protein ⓘ Shows how many calories you need to eat from this food to get 10 g of protein, calculated as (calories ÷ protein in g) × 10. | 280 kcal |
| Weight per 100 calories ⓘ Shows how many grams of this food equal 100 kcal—higher grams mean a larger portion for the same calories. | 65 g |
| Unsaturated / Saturated Fat ratio ⓘ (monounsaturated + polyunsaturated) / saturated, ≥2 broadly recommended by major guidelines for heart health | 1.5 |
Baked beans Glycemic index (GI)
Baked beans Glycemic load (GL)
Mineral coverage chart
Mineral chart - relative view
Vitamin coverage chart
Vitamin chart - relative view
Protein quality breakdown
Fat type information
All nutrients for Baked beans per 100g
| Nutrient | Value | DV% | In TOP % of foods | Comparison |
| Vitamin A | 0µg | 0% | 100% | |
| Calories | 155kcal | 8% | 59% |
3.3 times more than Orange
|
| Protein per 100 calories | 3.6g | N/A | 55% | |
| Calories per 10 g protein | 280kcal | N/A | 42% | |
| Weight per 100 calories | 65g | N/A | 42% | |
| Protein | 5.5g | 13% | 59% |
2 times more than Broccoli
|
| Unsaturated / Saturated Fat ratio | 1.5 | N/A | 58% | |
| Fats | 5.2g | 8% | 50% |
6.5 times less than Cheese
|
| Vitamin C | 1.1mg | 1% | 32% |
48.2 times less than Lemon
|
| Net carbs | 16g | N/A | 37% |
3.4 times less than Chocolate
|
| Carbs | 22g | 7% | 33% |
1.3 times less than Rice
|
| Cholesterol | 5mg | 2% | 48% |
74.6 times less than Egg
|
| Vitamin D* | 0 IU | 0% | 100% |
N/A
|
| Vitamin D | 0µg | 0% | 100% |
N/A
|
| Magnesium | 43mg | 10% | 16% |
3.3 times less than Almonds
|
| Calcium | 61mg | 6% | 27% |
2 times less than Milk
|
| Potassium | 358mg | 11% | 20% |
2.4 times more than Cucumber
|
| Iron | 2mg | 25% | 37% |
1.3 times less than Beef broiled
|
| Fiber | 5.5g | 22% | 11% |
2.3 times more than Orange
|
| Copper | 0.16mg | 18% | 22% |
1.1 times more than Shiitake
|
| Zinc | 0.73mg | 7% | 53% |
8.6 times less than Beef broiled
|
| Phosphorus | 109mg | 16% | 56% |
1.7 times less than Chicken meat
|
| Sodium | 422mg | 18% | 24% |
1.2 times less than White bread
|
| Manganese | 0.26mg | 11% | 24% | |
| Selenium | 5.7µg | 10% | 47% | |
| Vitamin B1 | 0.14mg | 11% | 34% |
2 times less than Pea raw
|
| Vitamin B2 | 0.05mg | 4% | 75% |
2.7 times less than Avocado
|
| Vitamin B3 | 0.41mg | 3% | 74% |
23.5 times less than Turkey meat
|
| Vitamin B5 | 0.16mg | 3% | 59% |
7.3 times less than Sunflower seeds
|
| Vitamin B6 | 0.09mg | 7% | 57% |
1.3 times less than Oats
|
| Vitamin B12 | 0µg | 0% | 100% |
N/A
|
| Folate | 48µg | 12% | 21% |
1.3 times less than Brussels sprouts
|
| Trans fat | 0g | N/A | 100% |
N/A
|
| Saturated fat | 1.9g | 10% | 44% |
3 times less than Beef broiled
|
| Monounsaturated fat | 2.1g | N/A | 44% |
4.6 times less than Avocado
|
| Polyunsaturated fat | 0.74g | N/A | 45% |
63.7 times less than Walnut
|
| Tryptophan | 0.07mg | 0% | 42% |
4.6 times less than Chicken meat
|
| Threonine | 0.23mg | 0% | 41% |
3.2 times less than Beef broiled
|
| Isoleucine | 0.24mg | 0% | 42% |
3.8 times less than Salmon raw
|
| Leucine | 0.43mg | 0% | 43% |
5.7 times less than Tuna Bluefin
|
| Lysine | 0.38mg | 0% | 38% |
1.2 times less than Tofu
|
| Methionine | 0.09mg | 0% | 44% |
1.1 times less than Quinoa
|
| Phenylalanine | 0.29mg | 0% | 42% |
2.3 times less than Egg
|
| Valine | 0.28mg | 0% | 43% |
7.2 times less than Soybean raw
|
| Histidine | 0.15mg | 22% | 41% |
4.9 times less than Turkey meat
|
Check out similar food or compare with current
NUTRITION FACTS LABEL
Serving Size ______________
Health checks
Baked beans nutrition infographic
References
All the values for which the sources are not specified explicitly are taken from FDA’s Food Central. The exact link to the food presented on this page can be found below.